My Easter Sunday was unusual.
Sure, I ate the traditional spiral ham for dinner, but I was at sea and my family was nowhere in sight.
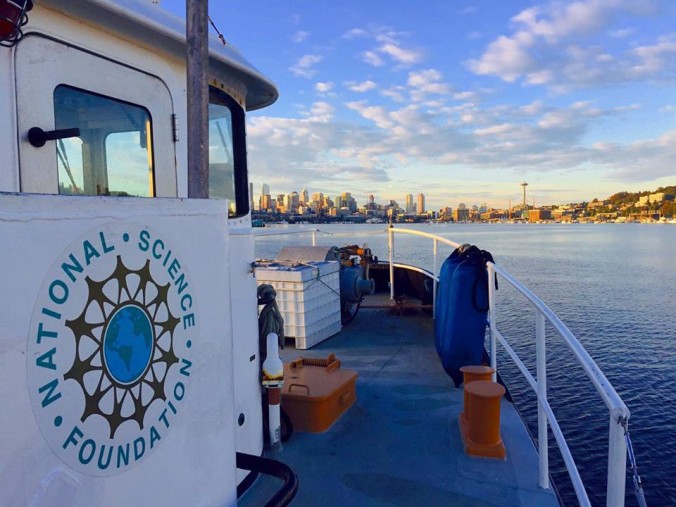
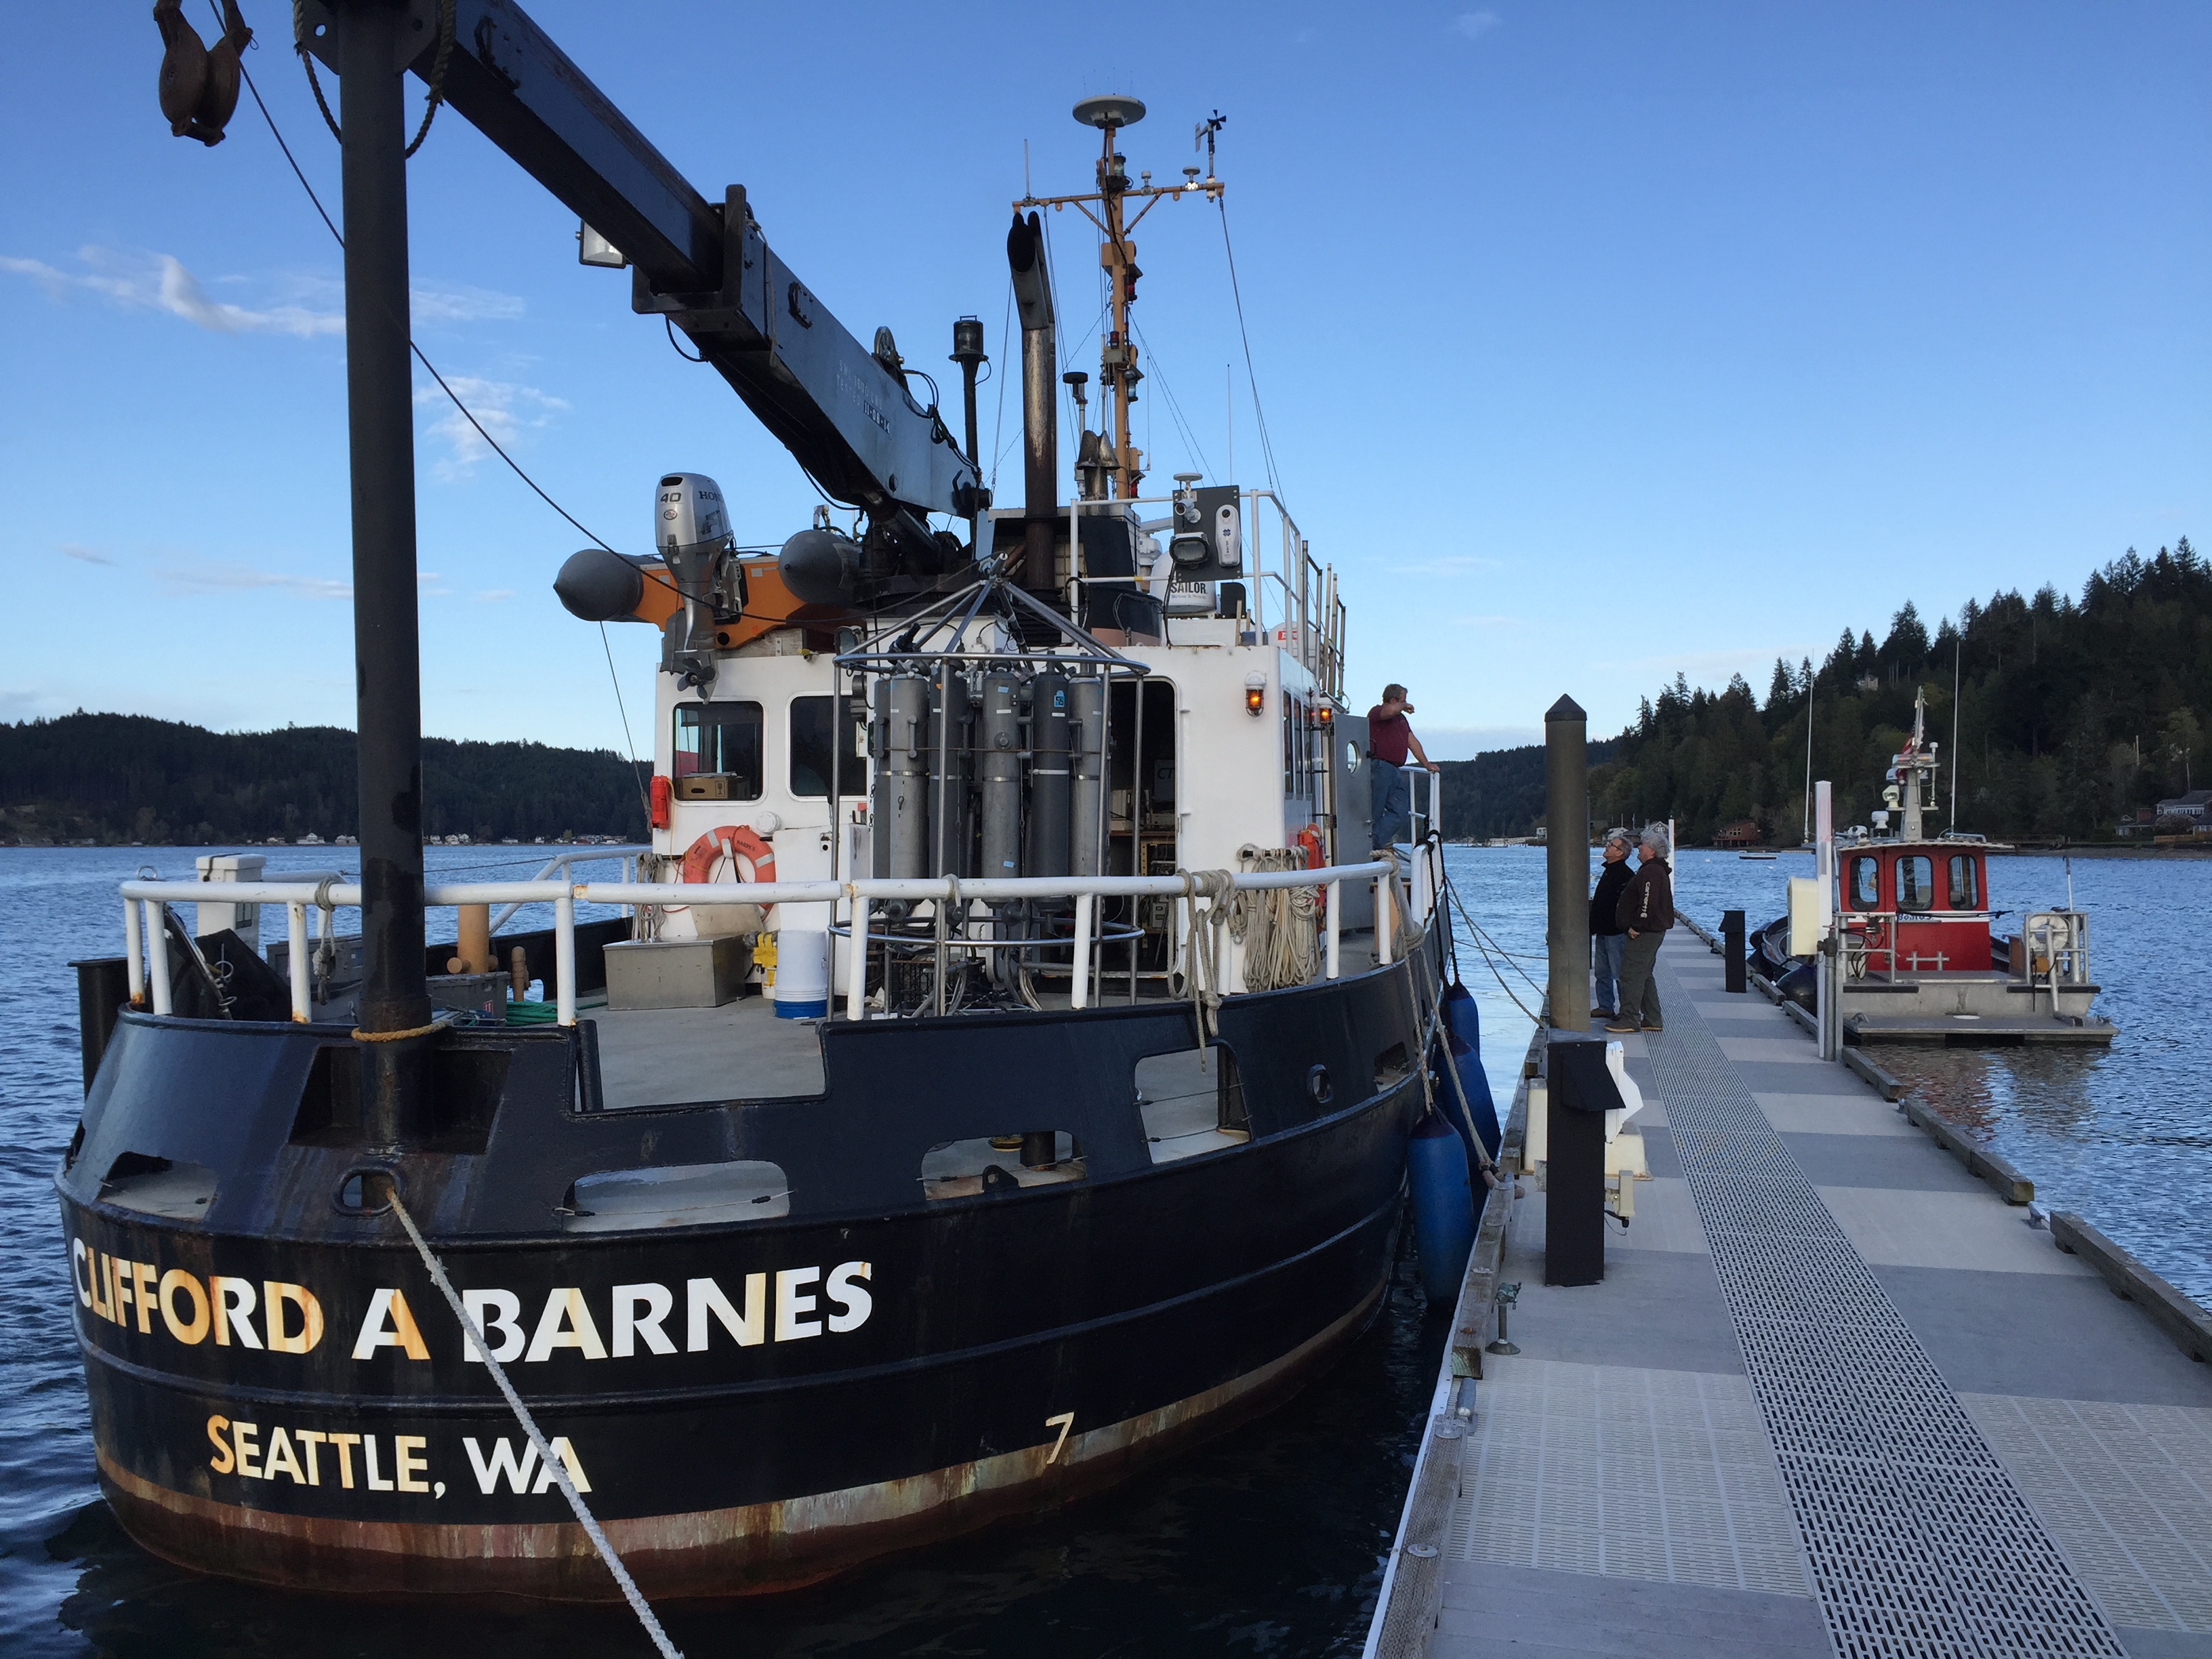
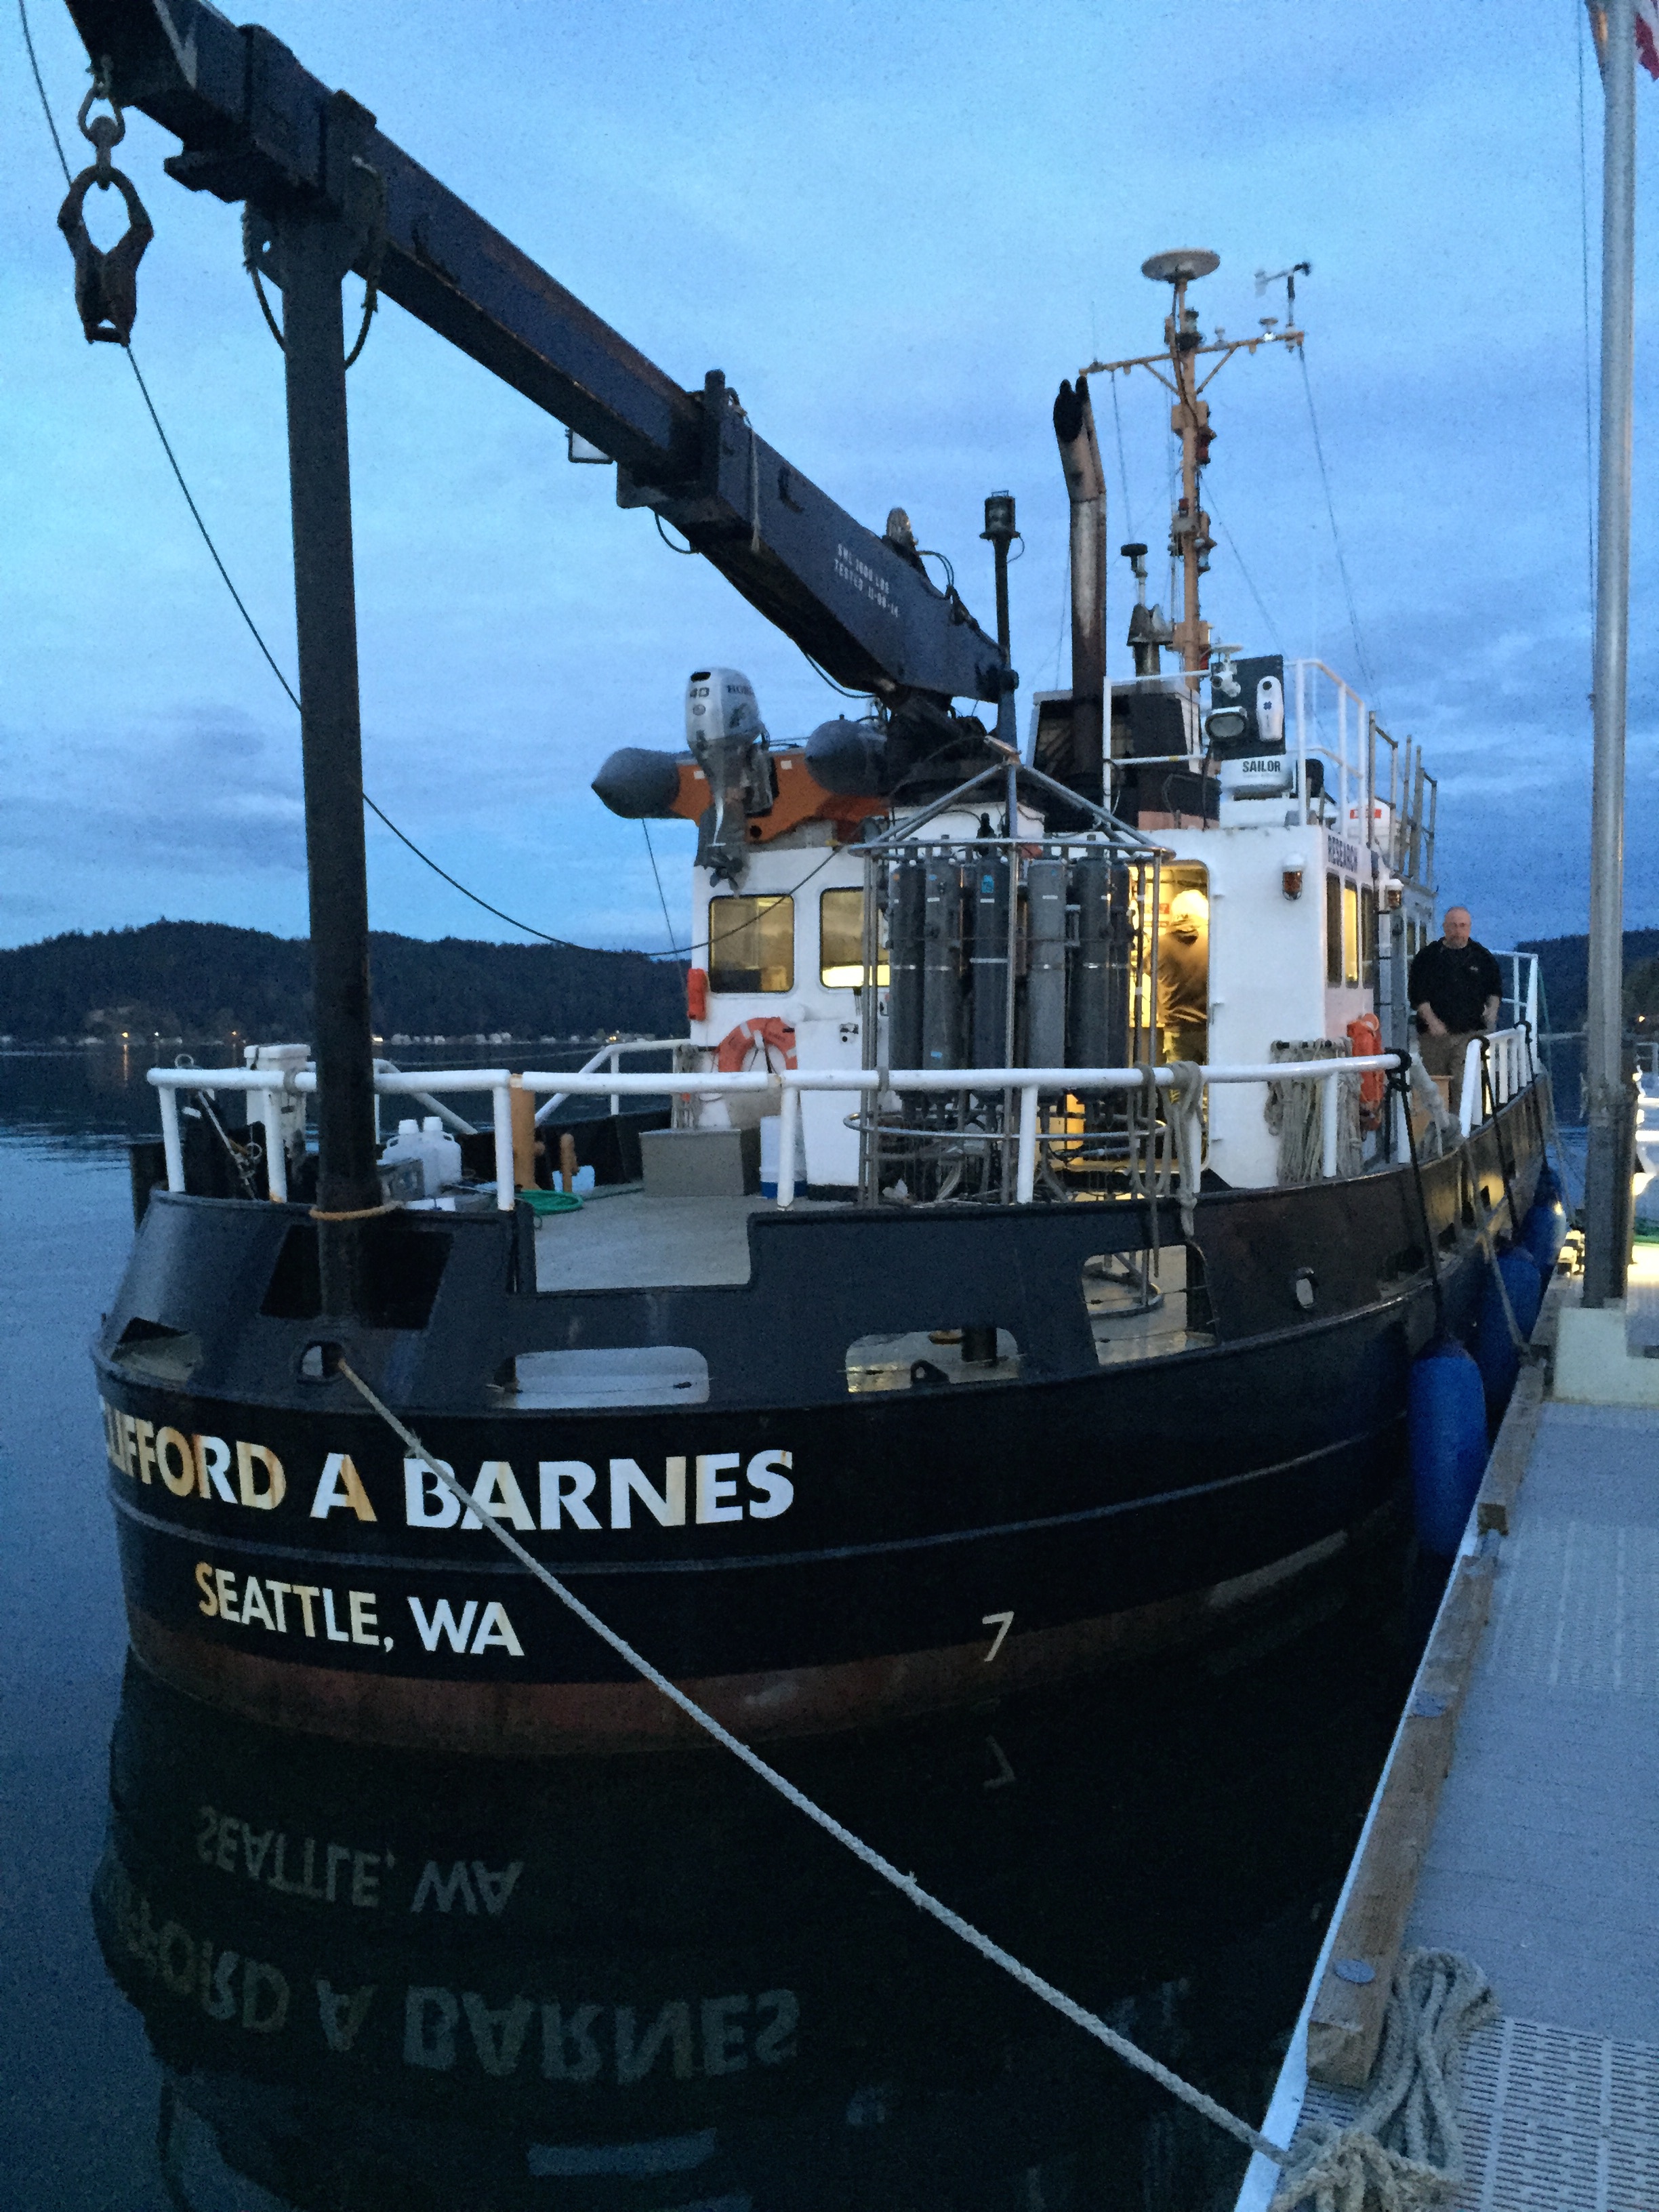
I was with eight strangers aboard the R/V Clifford A Barnes cruising around the Puget Sound for six-days of research monitoring ocean acidification, referred to as OA for short.
In honor of the sea and the nature of the project, I feel I should have been eating oysters for Easter dinner!
What is this Ocean Acidification you keep talking about?
If you’ve never heard of this term, and want to know more about it (which you should want to), I will redirect you to the links found on the University of Washington’s College of the Environment’s host website. Spend some time here familiarizing yourself with the globally important terms and what it means to our environment’s health:
- What is OA?
- What about OA in the Pacific Northwest?
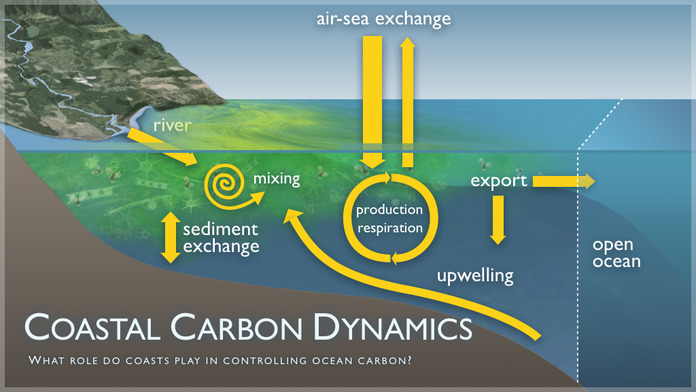
Below are some great graphics illustrating the important fluxes occurring in the environmental system. Take a good look at all the arrows and think about your personal experience with each. Images are from NOAA PMEL.
Changing Oceans, Changing Biology
It is easy to think of the ocean as a big vast body of empty water that doesn’t need much attention. Maybe you’ll think of a couple animals that live there like whales, sharks, and coral reefs. You’ll easily identify with currents and tides washing up on the beach if you’re a tide-pool lover or beach comber. The beauty of the oceans is that there is so much more than that. What most people take for granted is all of the intricate dynamic exchanges occurring between land, air, and water which perfectly tie biology, chemistry and geology together!
Currently, a lot of attention is being directed to a particular exchange: atmospheric carbon dioxide with the oceans. The carbon dioxide being released into the atmosphere (yes, predominately due to human needs for fuel) is absorbing into the oceans. This absorption into the ocean is a natural process as the gases in the ocean below like to be in equilibrium with the gases in the air above. However, once that carbon dioxide gets into the water it reacts with the water molecules setting off a whole chain of chemical reactions which lowers the ocean’s pH, termed ocean acidification. This rapid change we are seeing, which has been calculated to be escalating since the time of the Industrial Era, has us concerned about the chemistry and life in the oceans.
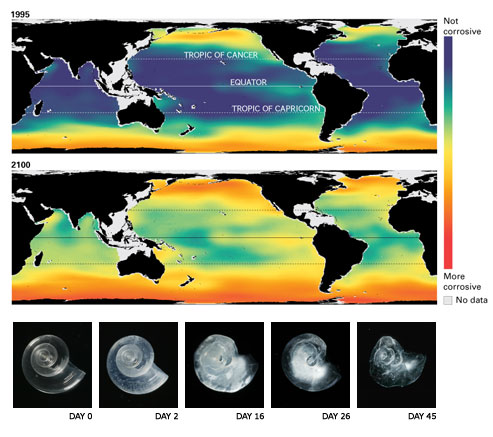
“If carbon dioxide continues to rise unchecked, computer models show that acidification will deplete carbonate ions in much of the ocean by 2100, turning the waters corrosive for many shell-building animals.”
From The Acid Test www.nationalgeographic.com
Why are we doing this cruise? … Because oysters.
No seriously, the reason us scientists are out here monitoring the waters comes from the birth of the Blue Ribbon Panel in 2011. This was enacted because, as in Governor Christine Gregoire’s own words, “Our shellfish industry employs thousands of people, and brings in millions of dollars to our state on an annual basis. Continued success depends on healthy ocean water.” The Blue Ribbon Panel is “a panel of science and policy experts to address the effects of ocean acidification on WA’s shellfish resources.”
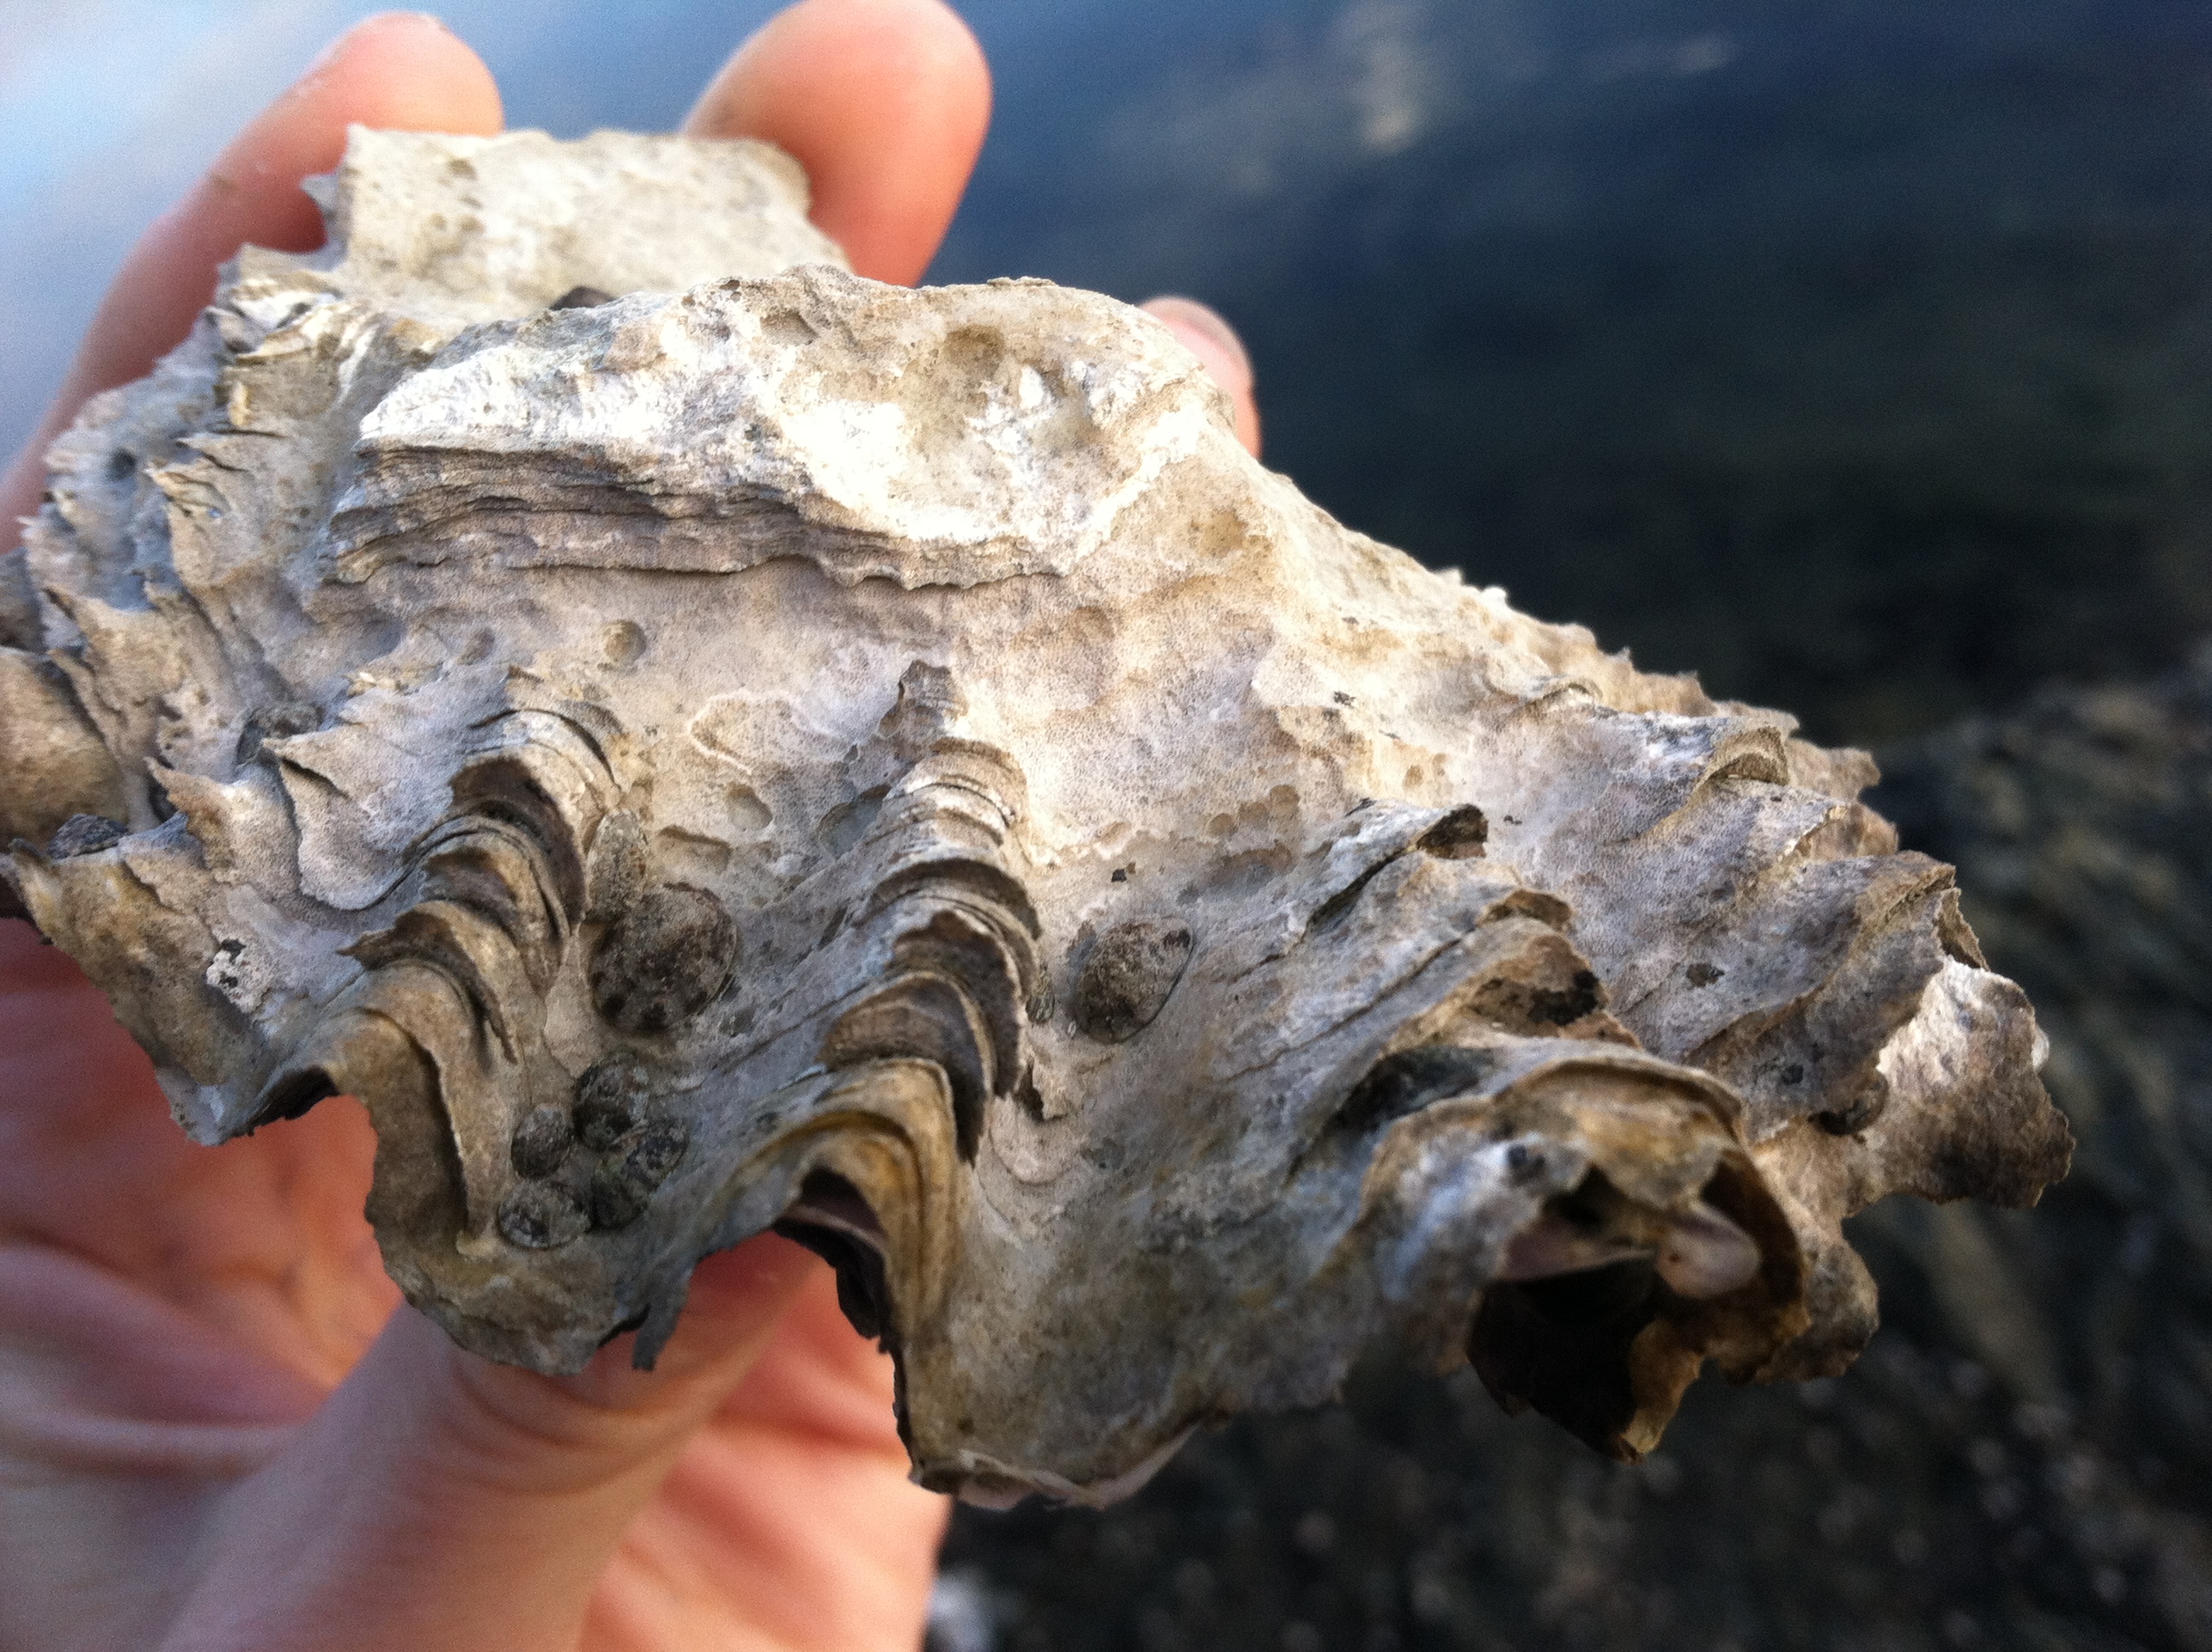
Science will save the oysters!
In 2013 the Blue Ribbon Panel spawned the Washington Ocean Acidification Center (WOAC, sounds like ‘whoa-wack’) . The legislature requires the Center to execute five priority actions. The cruise I am currently on exists in response to the second bullet point listed within the actions. We are not directly dealing with oysters but monitoring the health of the Puget Sound builds upon our knowledge of the areas which are pivotal for successful oyster growth and harvesting:
- Establish an expanded and sustained ocean acidification monitoring network to measure trends in local acidification conditions and related biological responses. This monitoring will allow detection of local acidification conditions and increase our scientific understanding of local species responses.
- Read more about progress on this priority action.
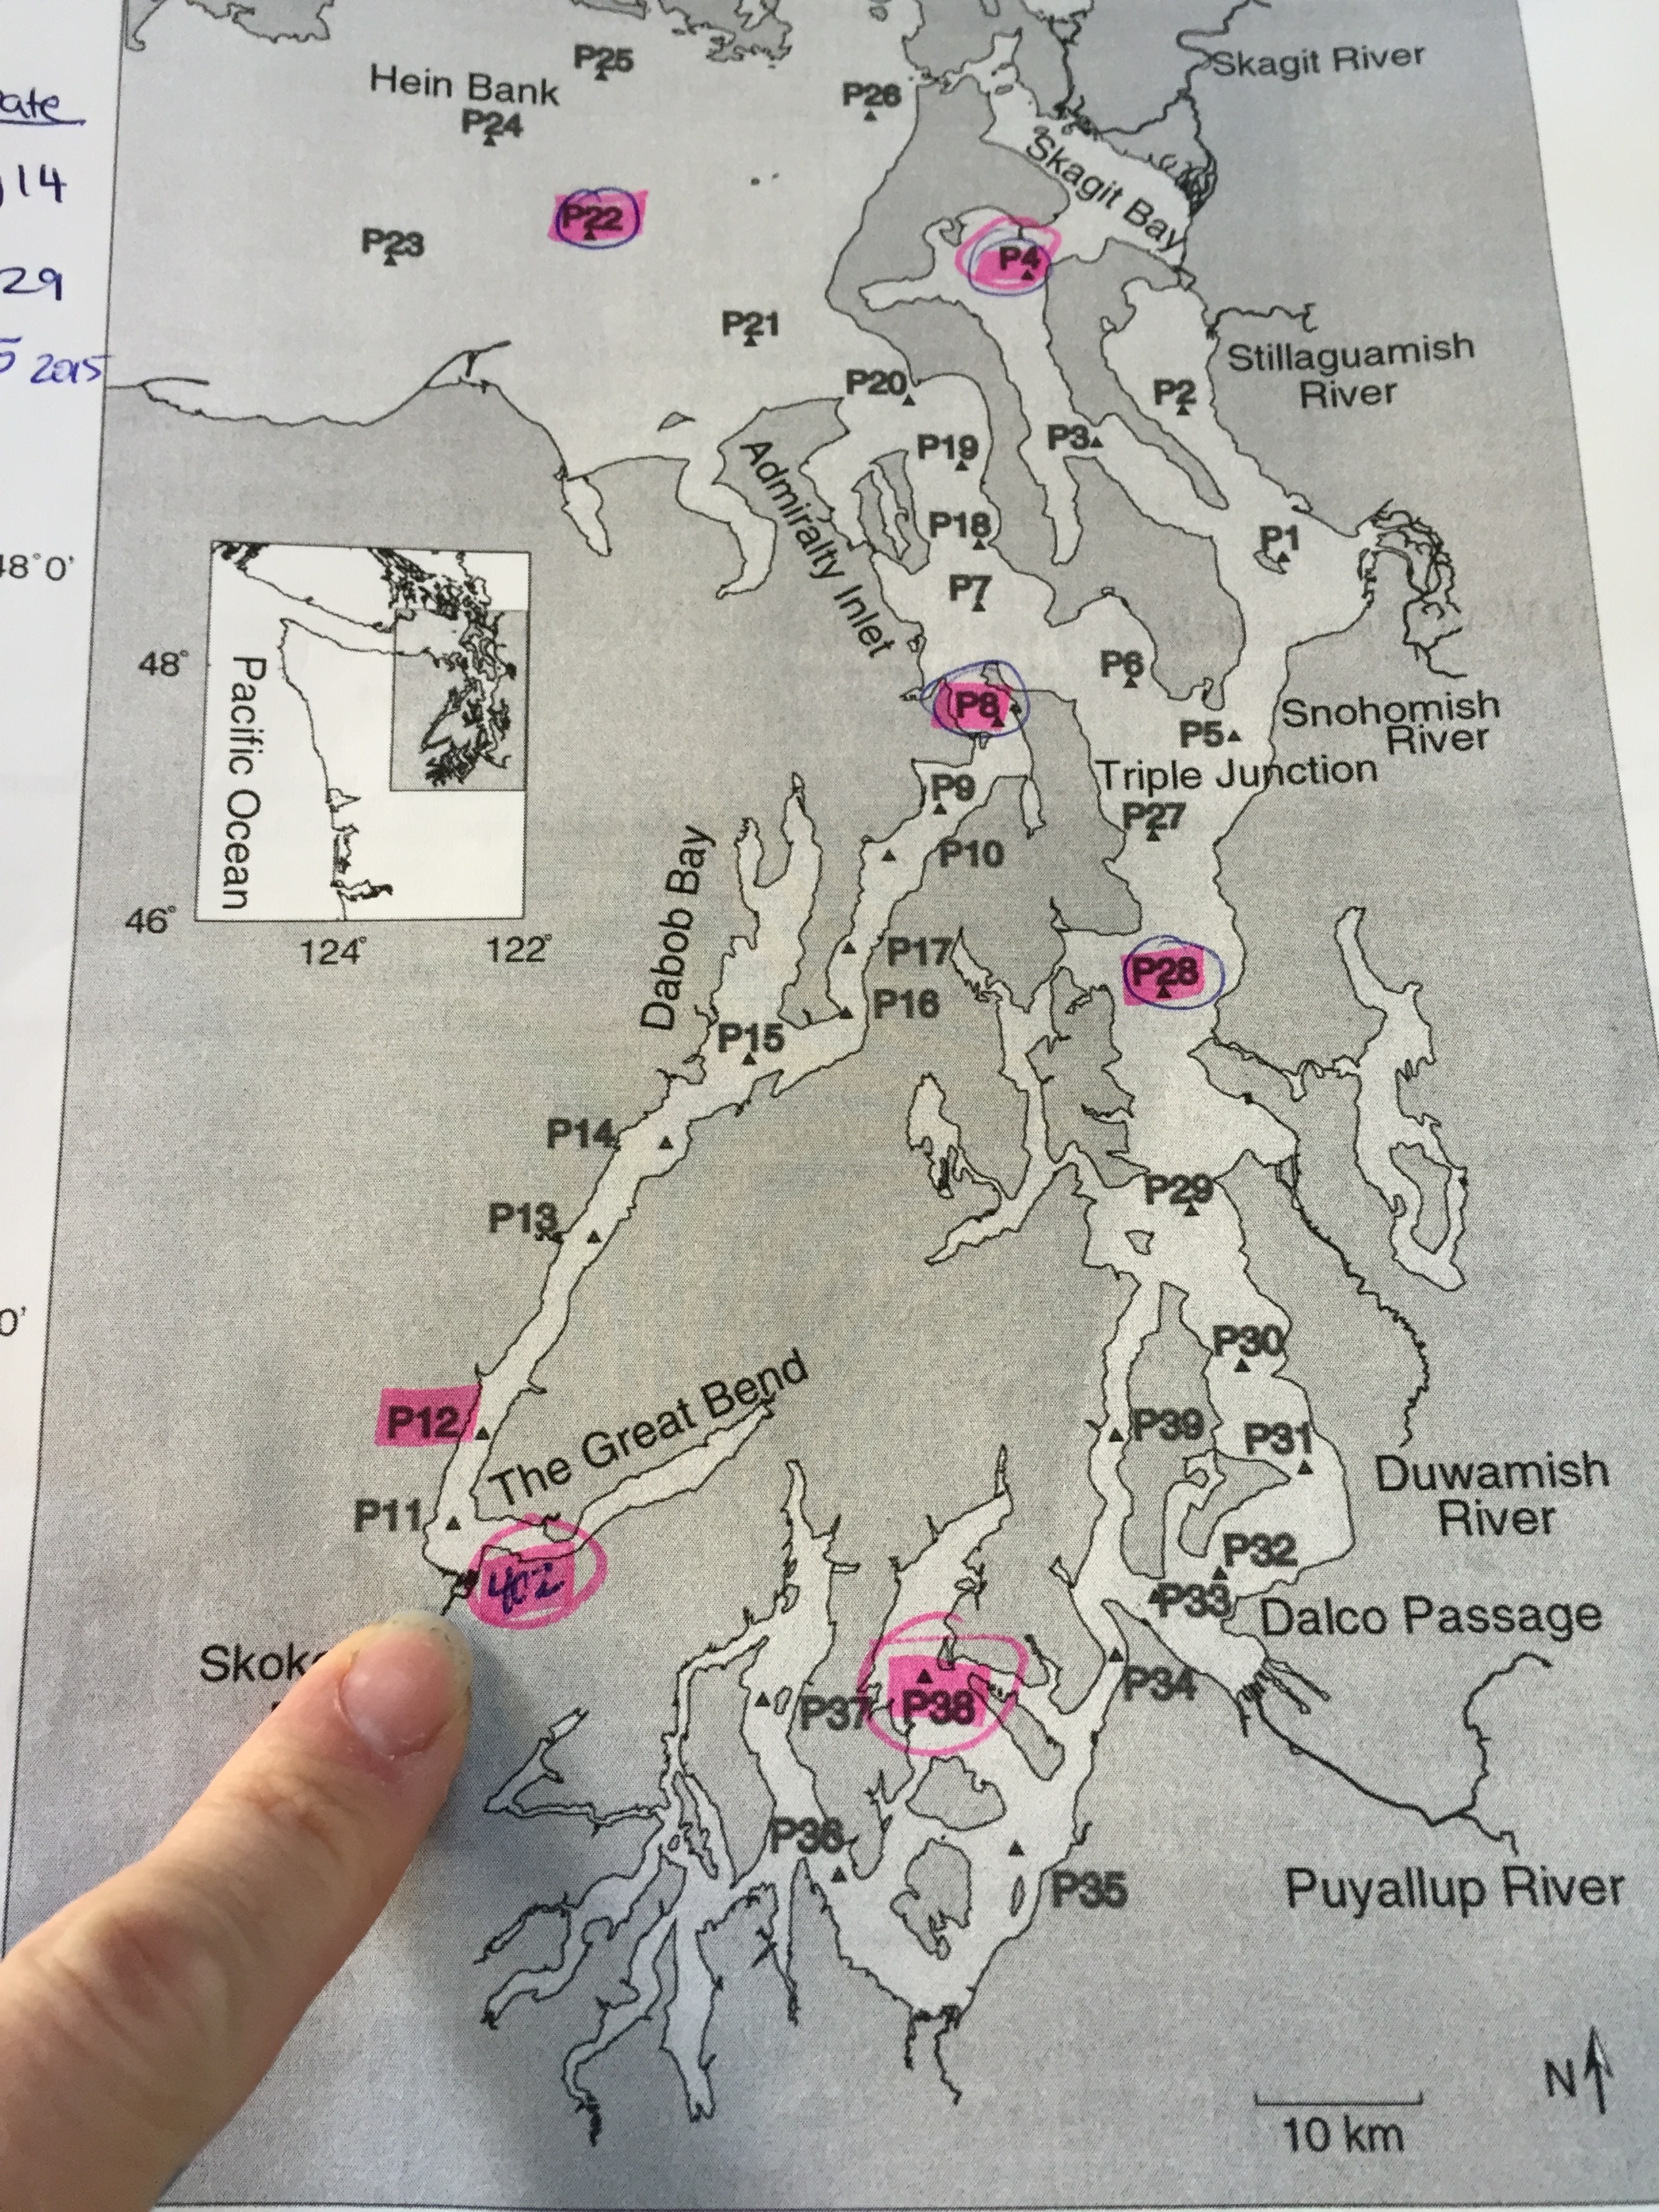
Below is a photo map of all the stations we will be visiting on this trip. The stations highlighted in pink are the specific locations my boss is interested in (more about that below). The ‘P’ indicates these are stations included in PRISM , the Puget Sound Regional Synthesis Model which sends biannual cruises within the greater Puget Sound to collect oceanographic time-series data. The network NANOOS was created as a place to hold more detailed scientific information and comprises over forty entities researching the Puget Sound as part of the ocean observing system.
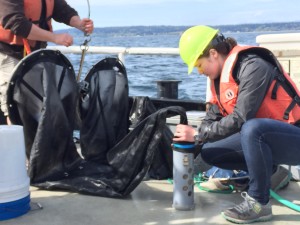
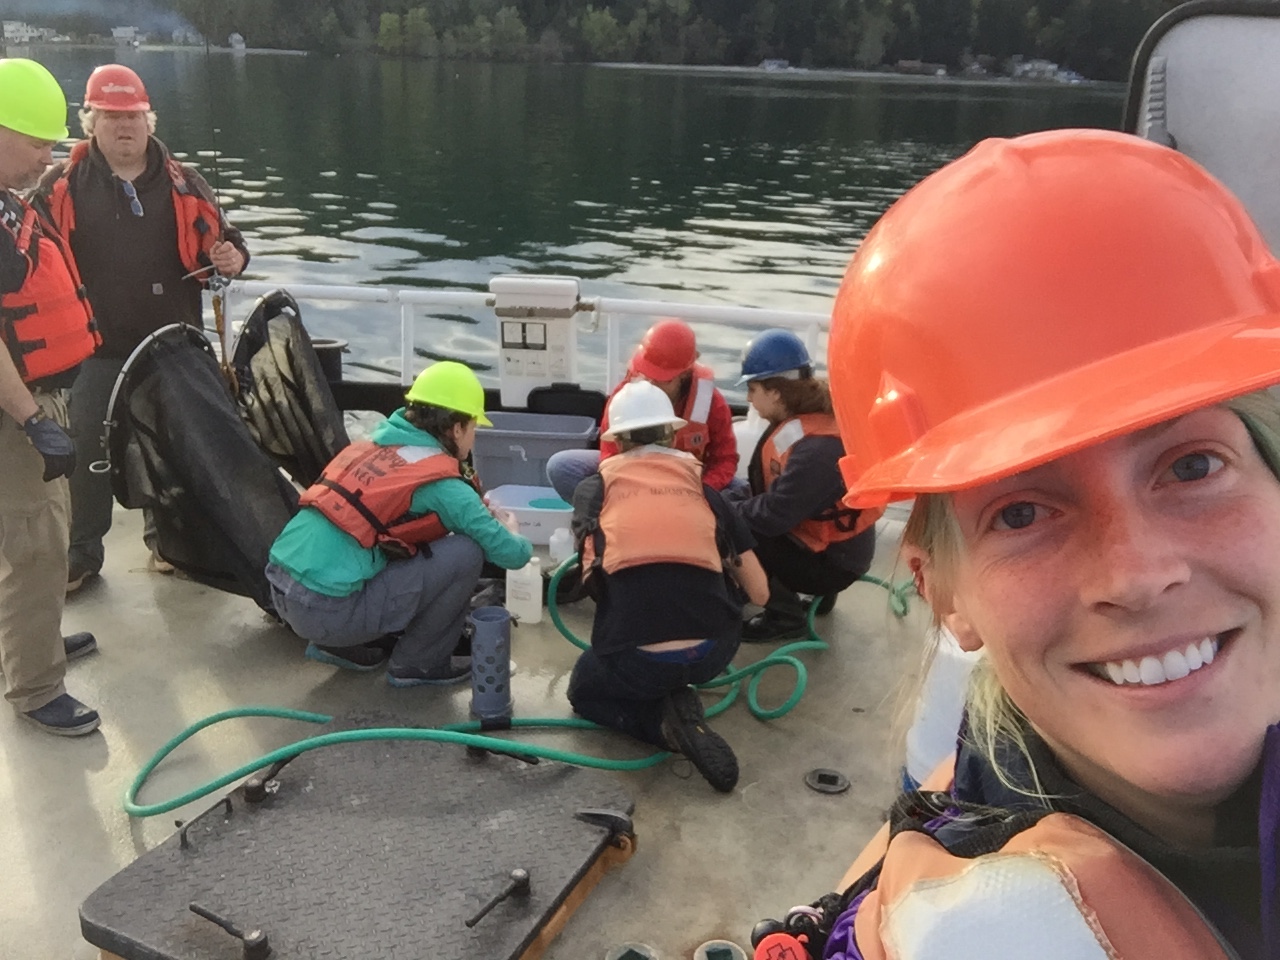
All Hands on Deck – How We Sample
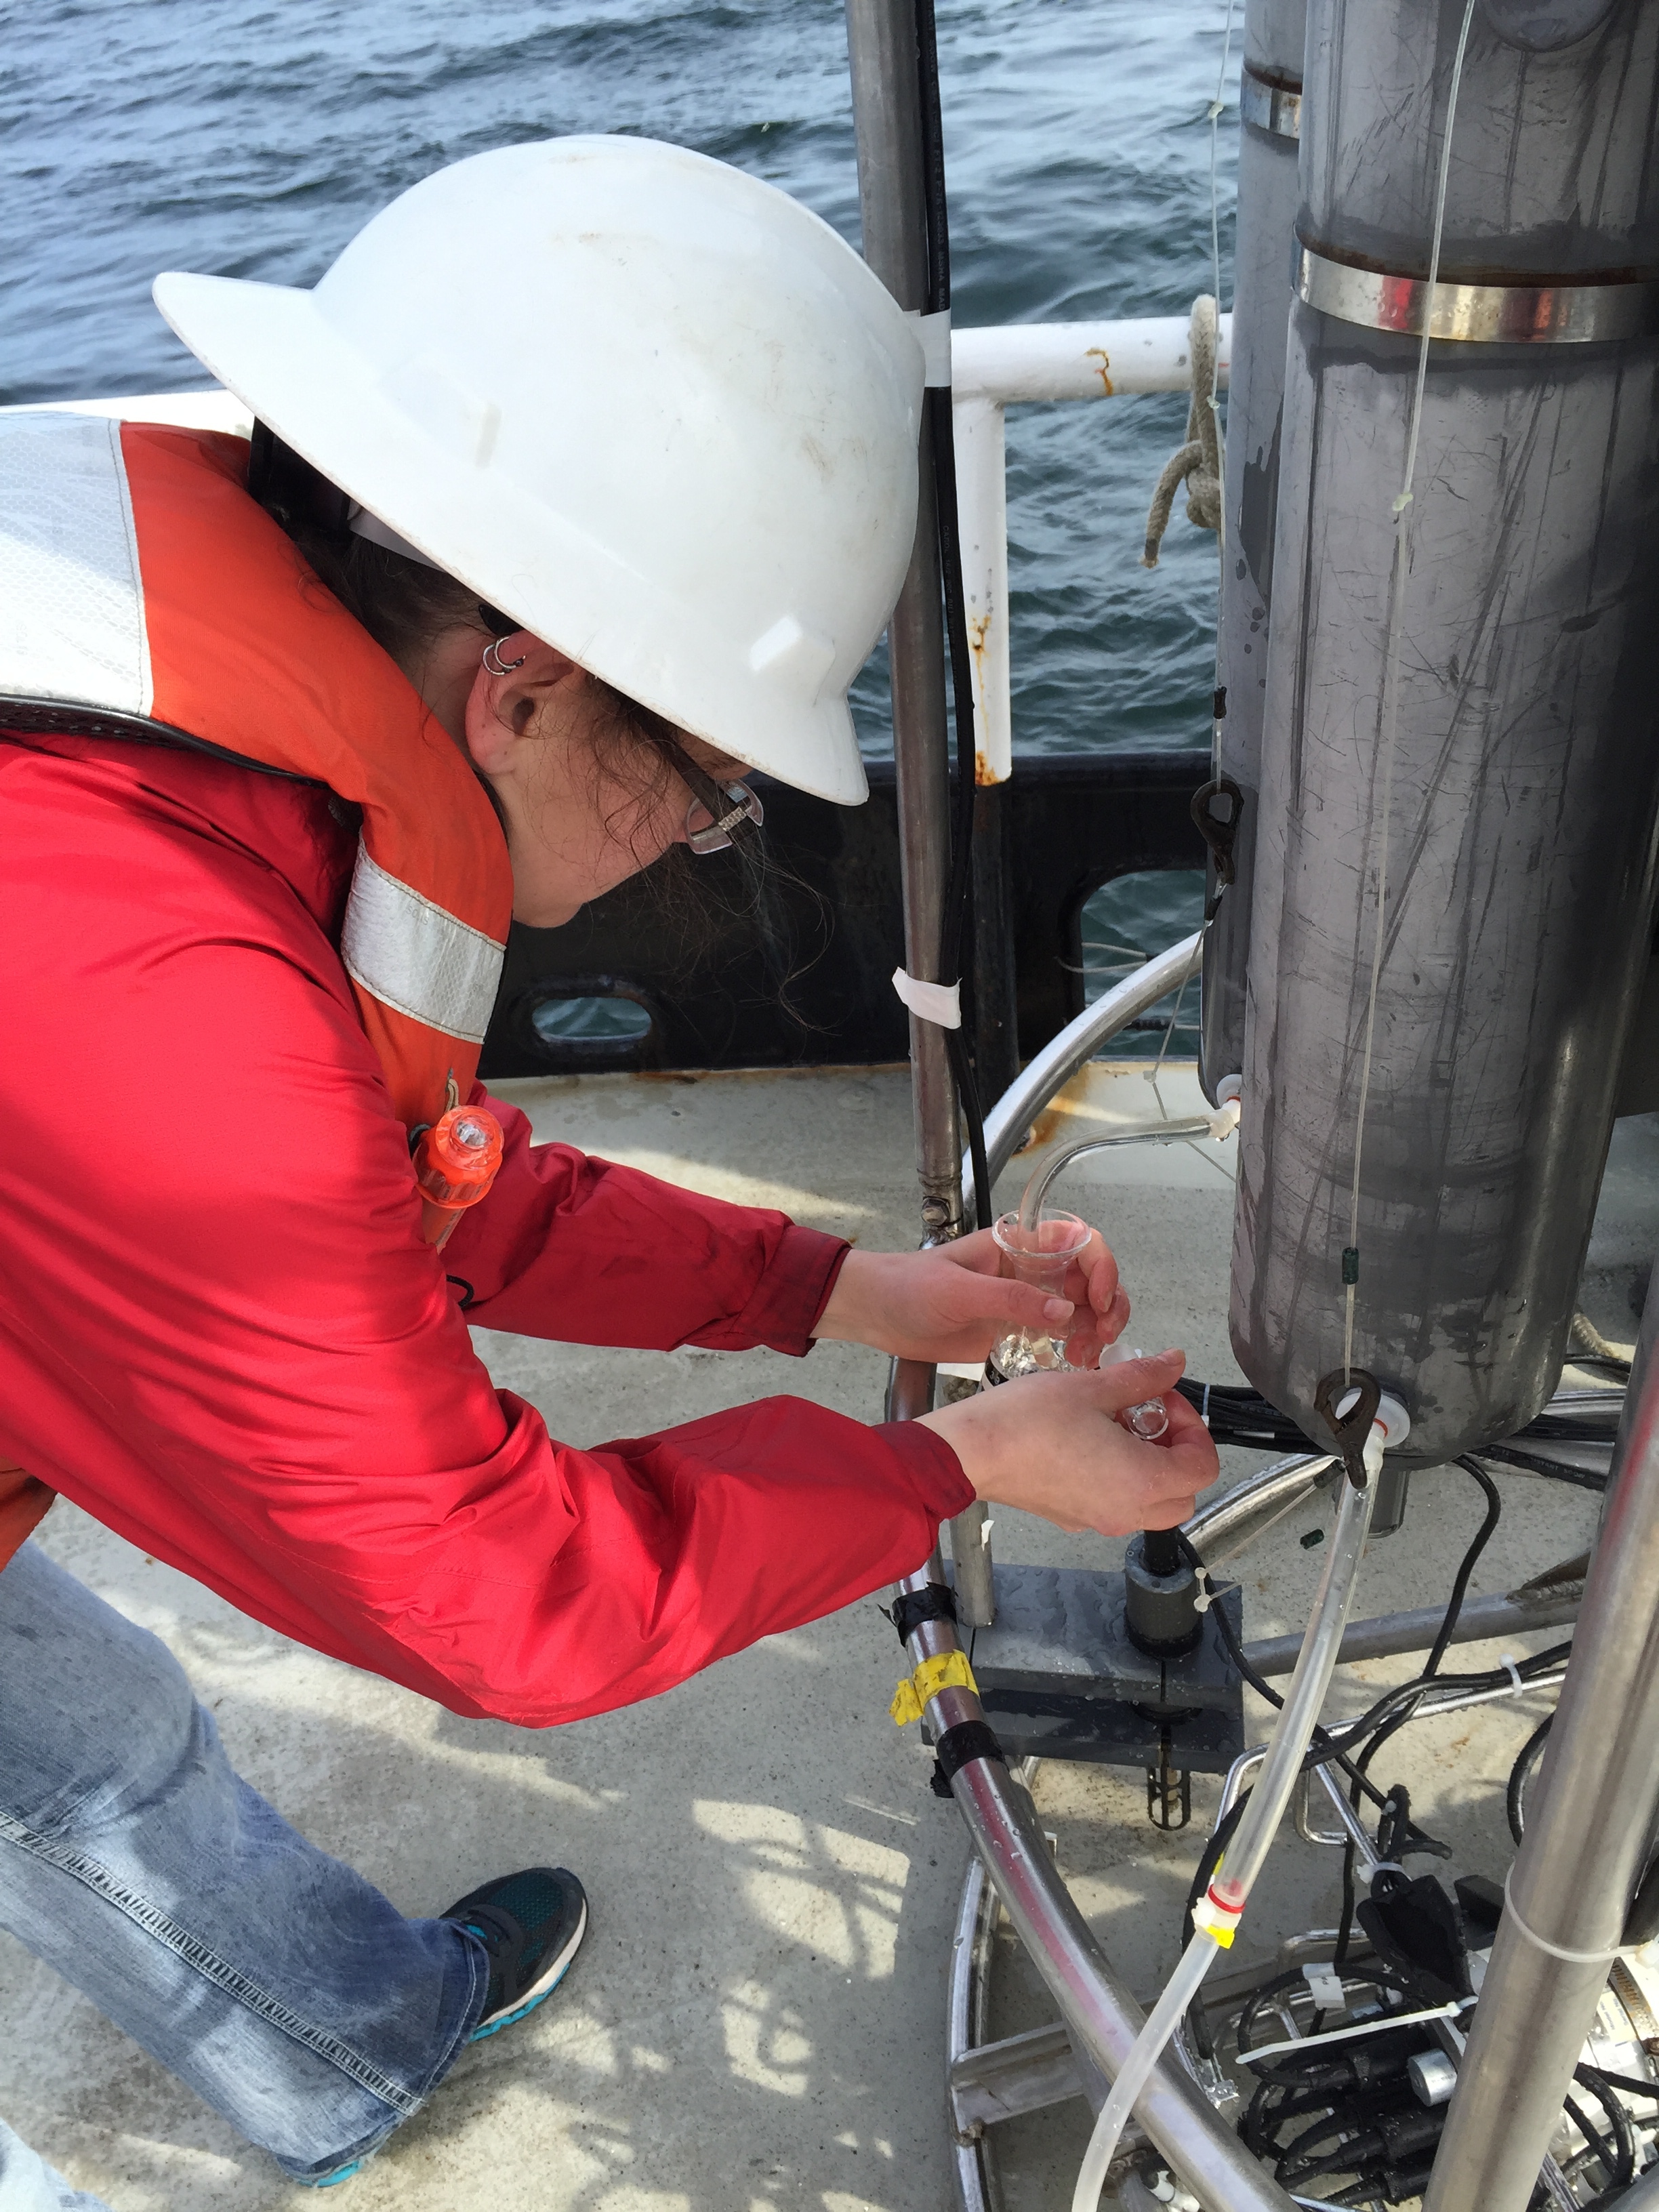
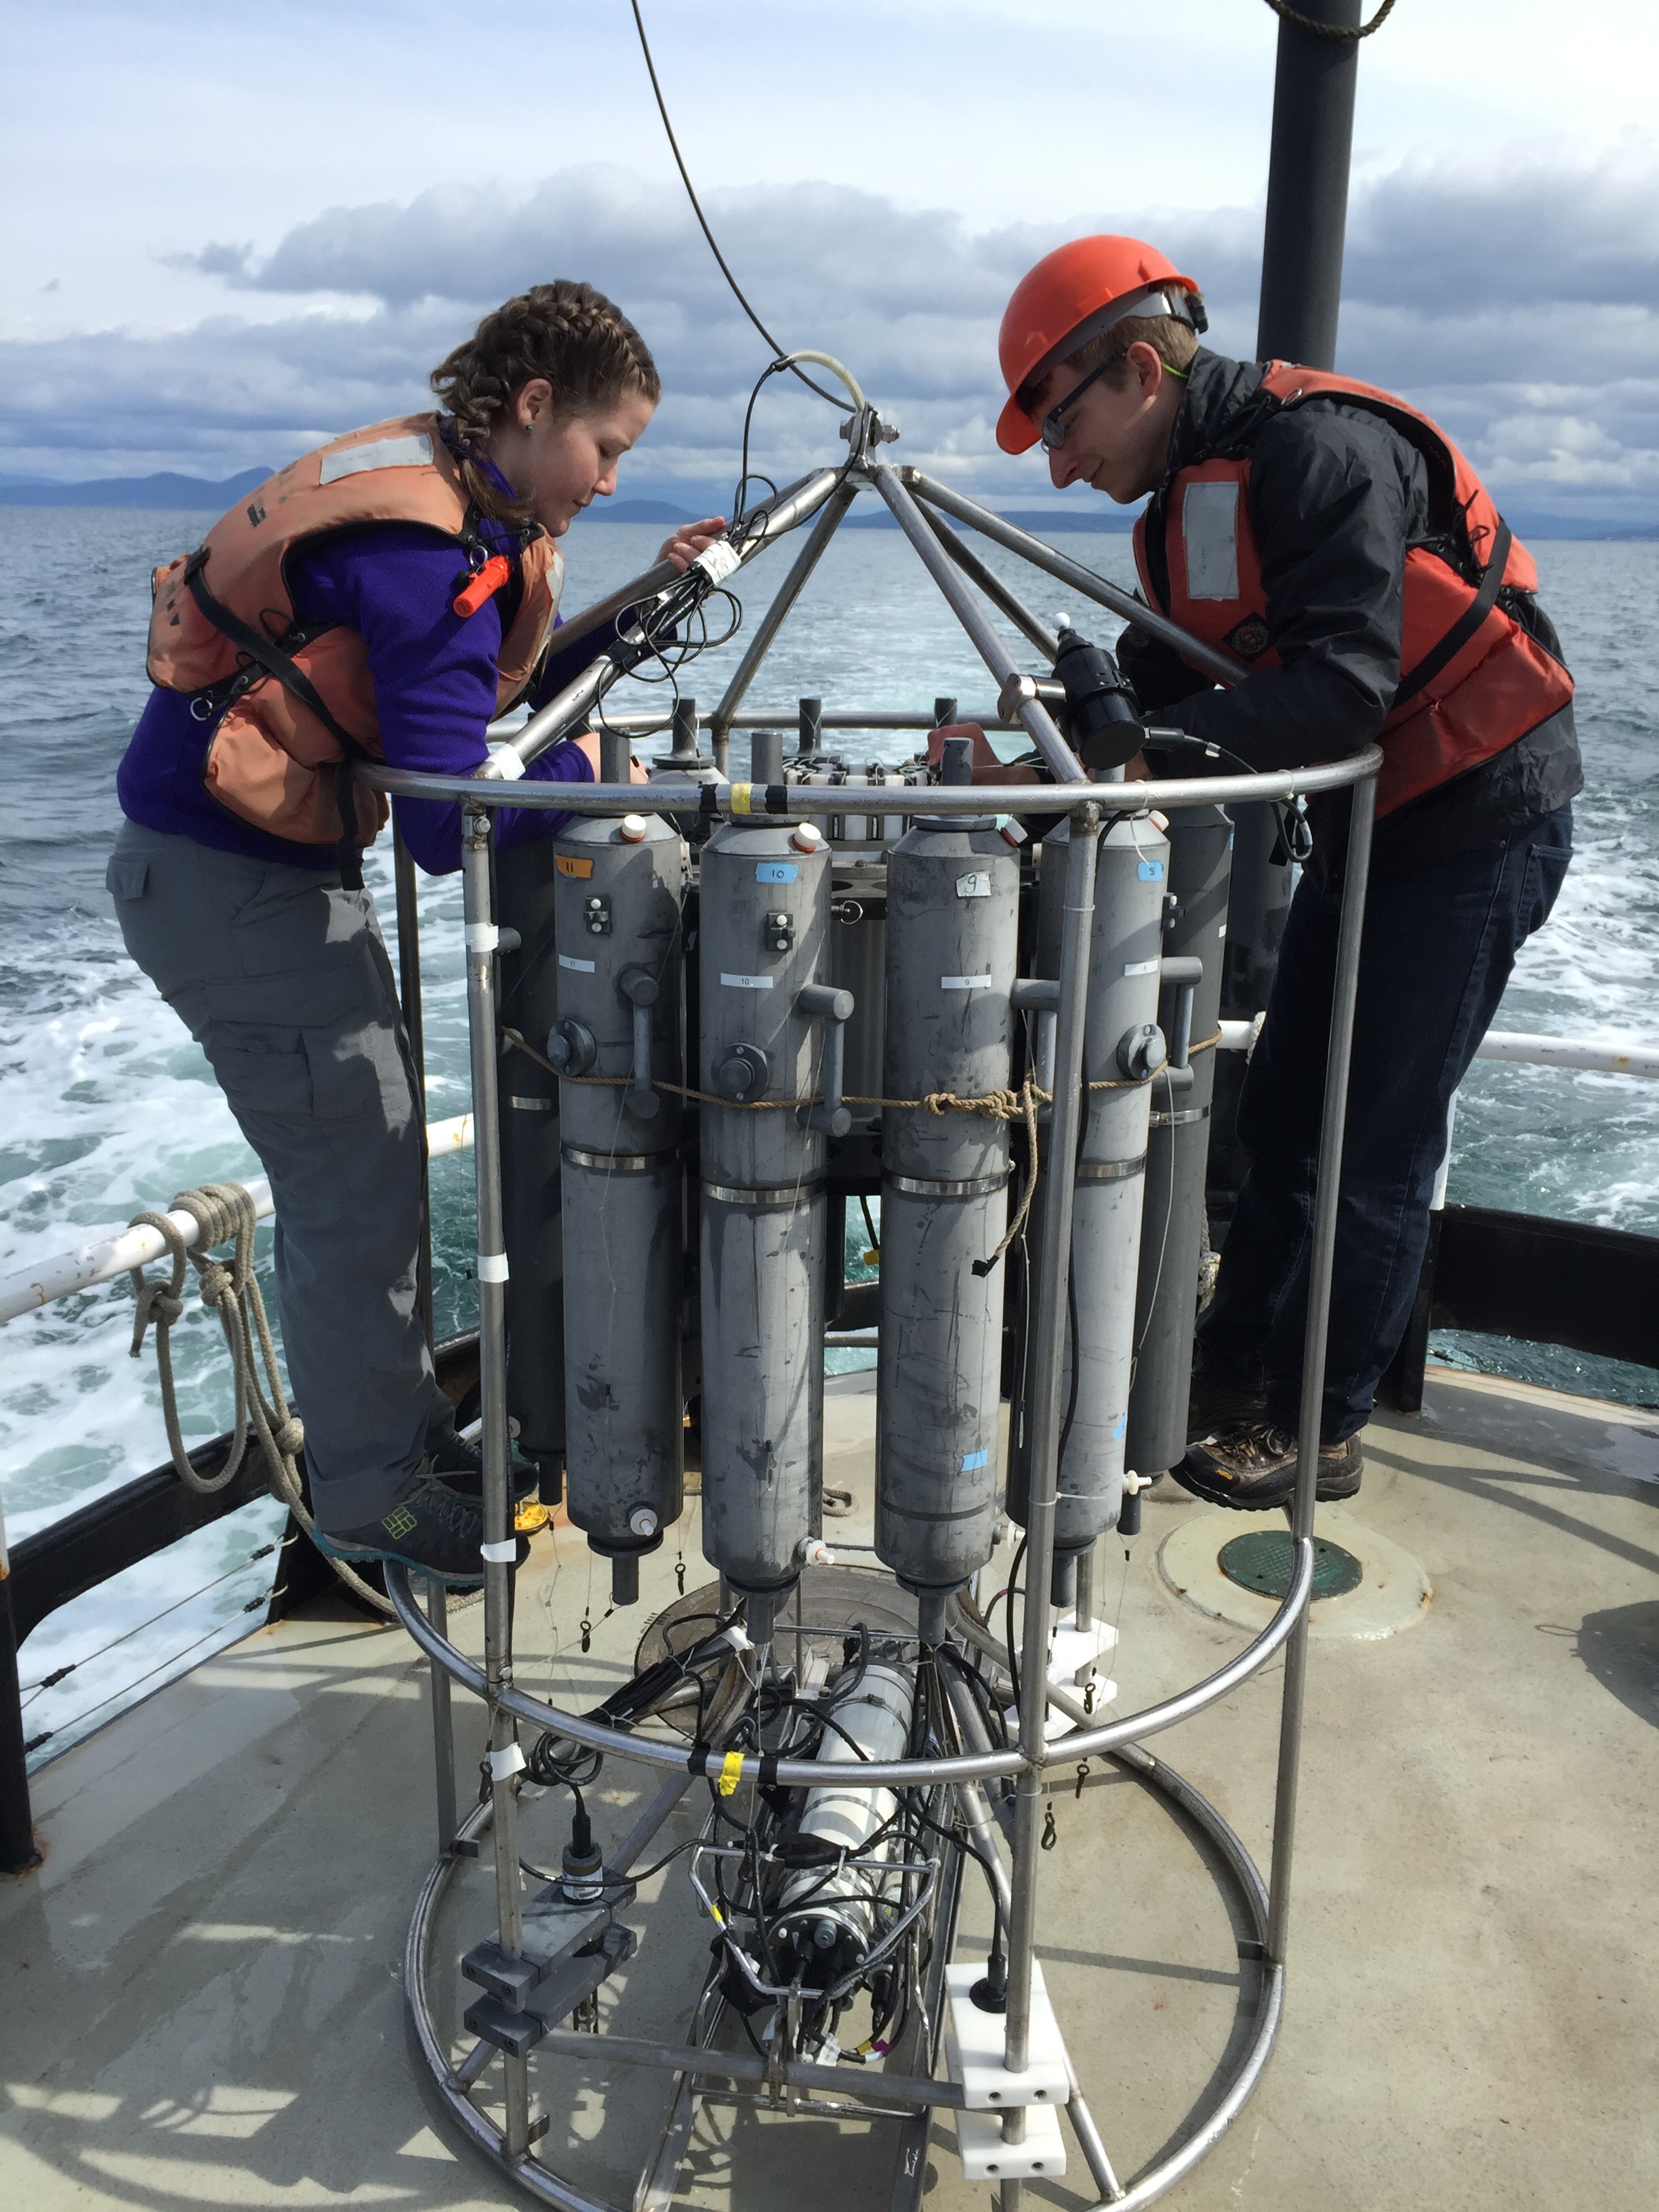 The contraption to the left is referred to as a CTD. This is a little package of sensors that measure Conductivity Temperature & Depth. It rides on the metal frame lined with gray Niskin bottles which we call a rosette.
The CTD comes up on deck full of sea water collected from different depths in the water column and we begin sampling for many different variables:
- oxygen
- dissolved inorganic carbon
- nutrients
- chlorophyll
- RNA/DNA
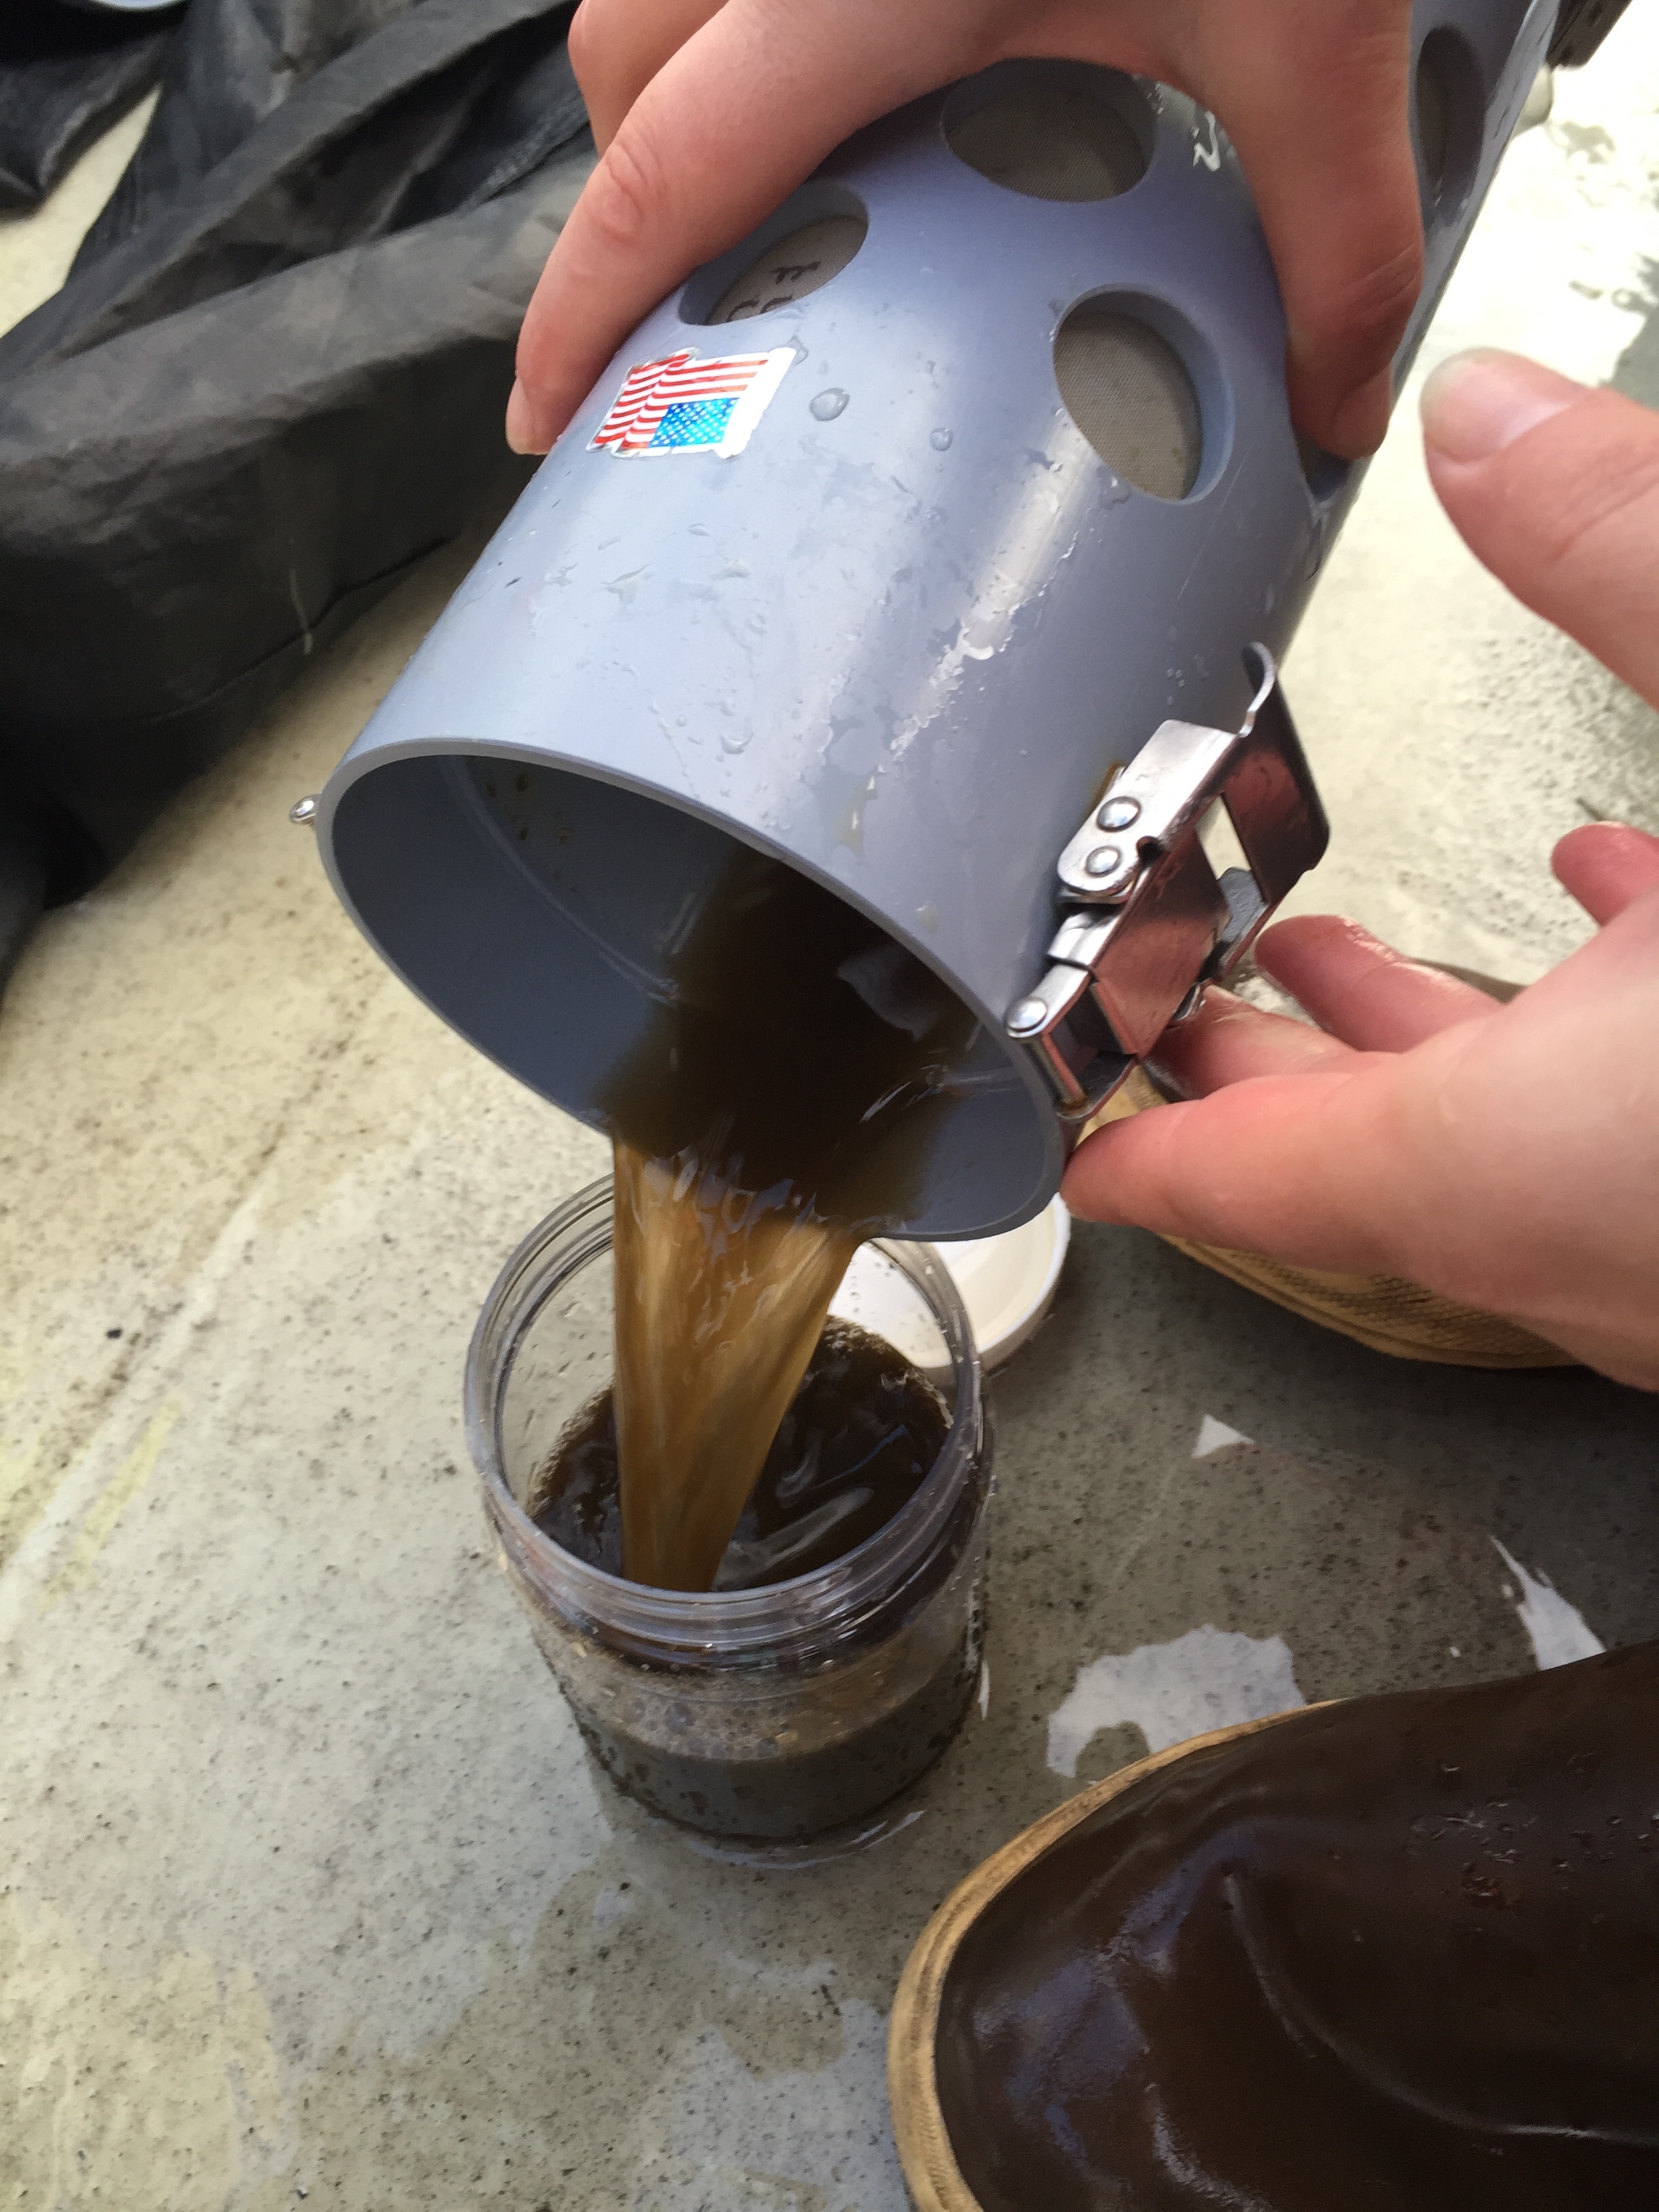
Rachel is the first to crack open the Niskin and takes a sample of seawater for oxygen measurements. It is important to get the sample stored into the bottle as soon as possible to limit the amount of time the sea water from depth is exposed to the atmosphere.
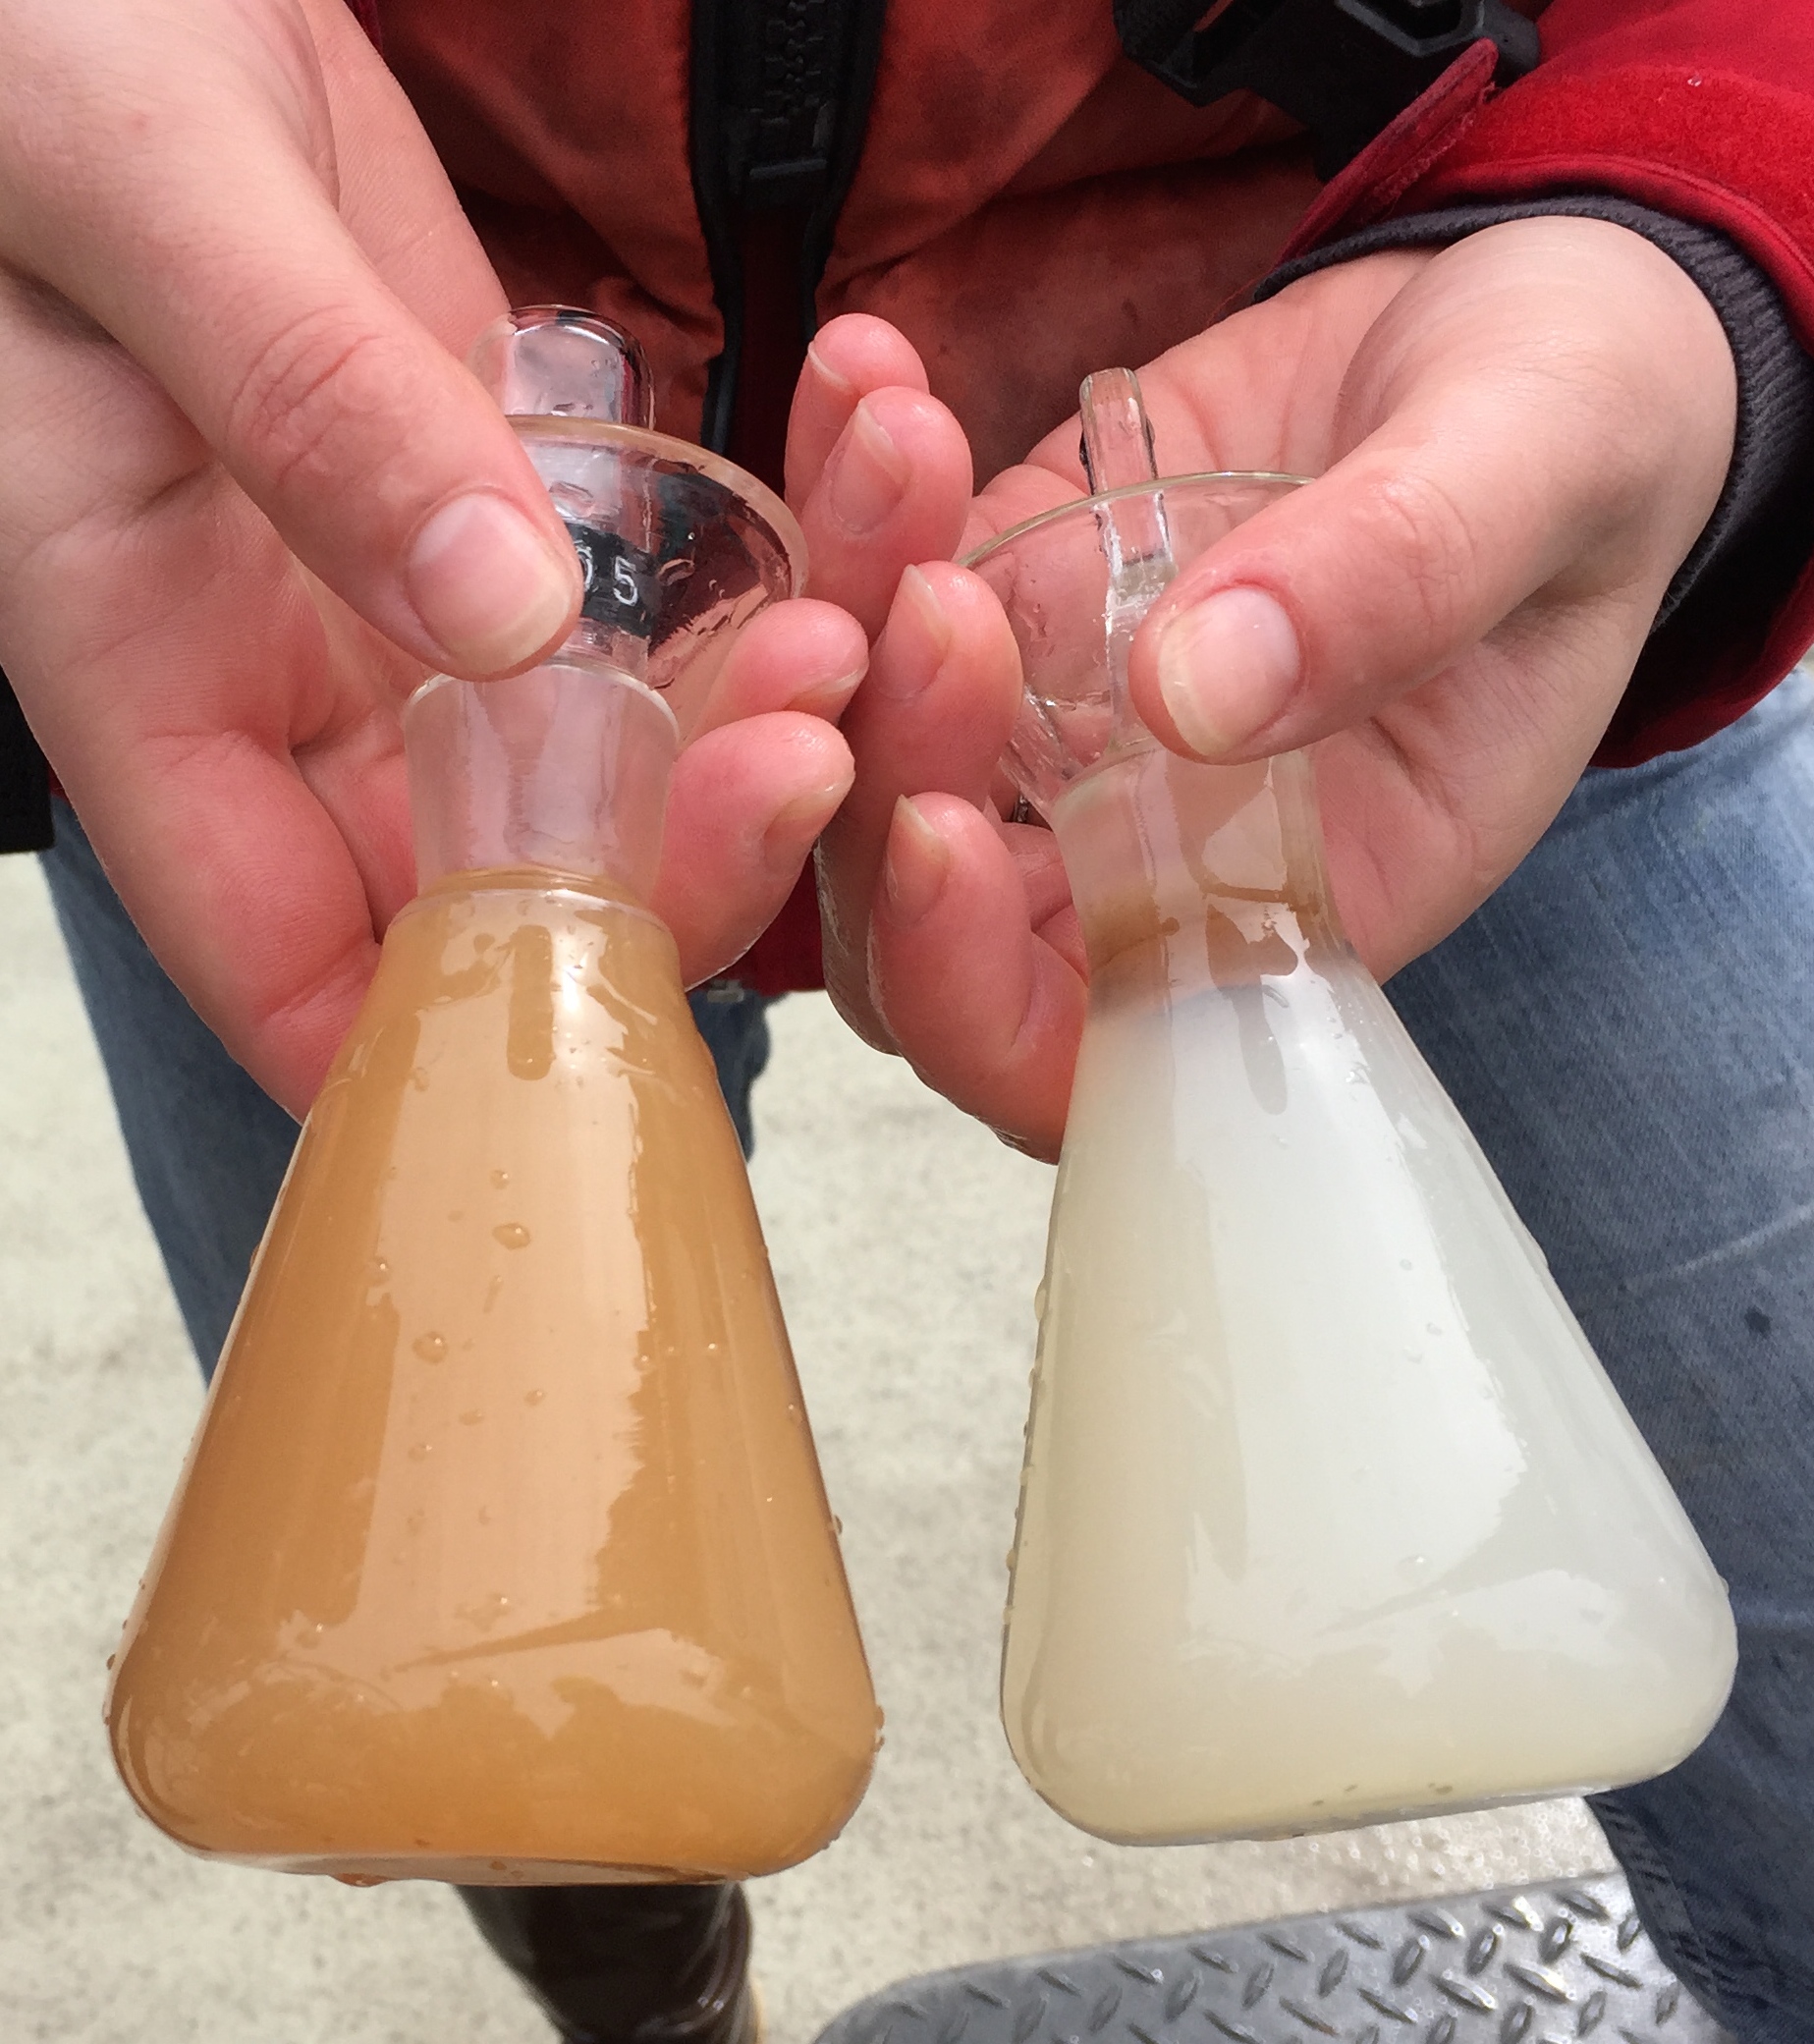
These two bottles, pictured below, contain sea water from Hood Canal. Chemicals are added which grab on to the oxygen within the water and create a precipitate (the orange color). The left sample is from the surface and has more oxygen which creates more precipitate making it orange. The right sample is from depth and has less oxygen which creates less precipitate making it less orange (whitish).
Next, the plankton nets are deployed. On this cruise we run three types of tows: vertical, horizontal, & oblique.
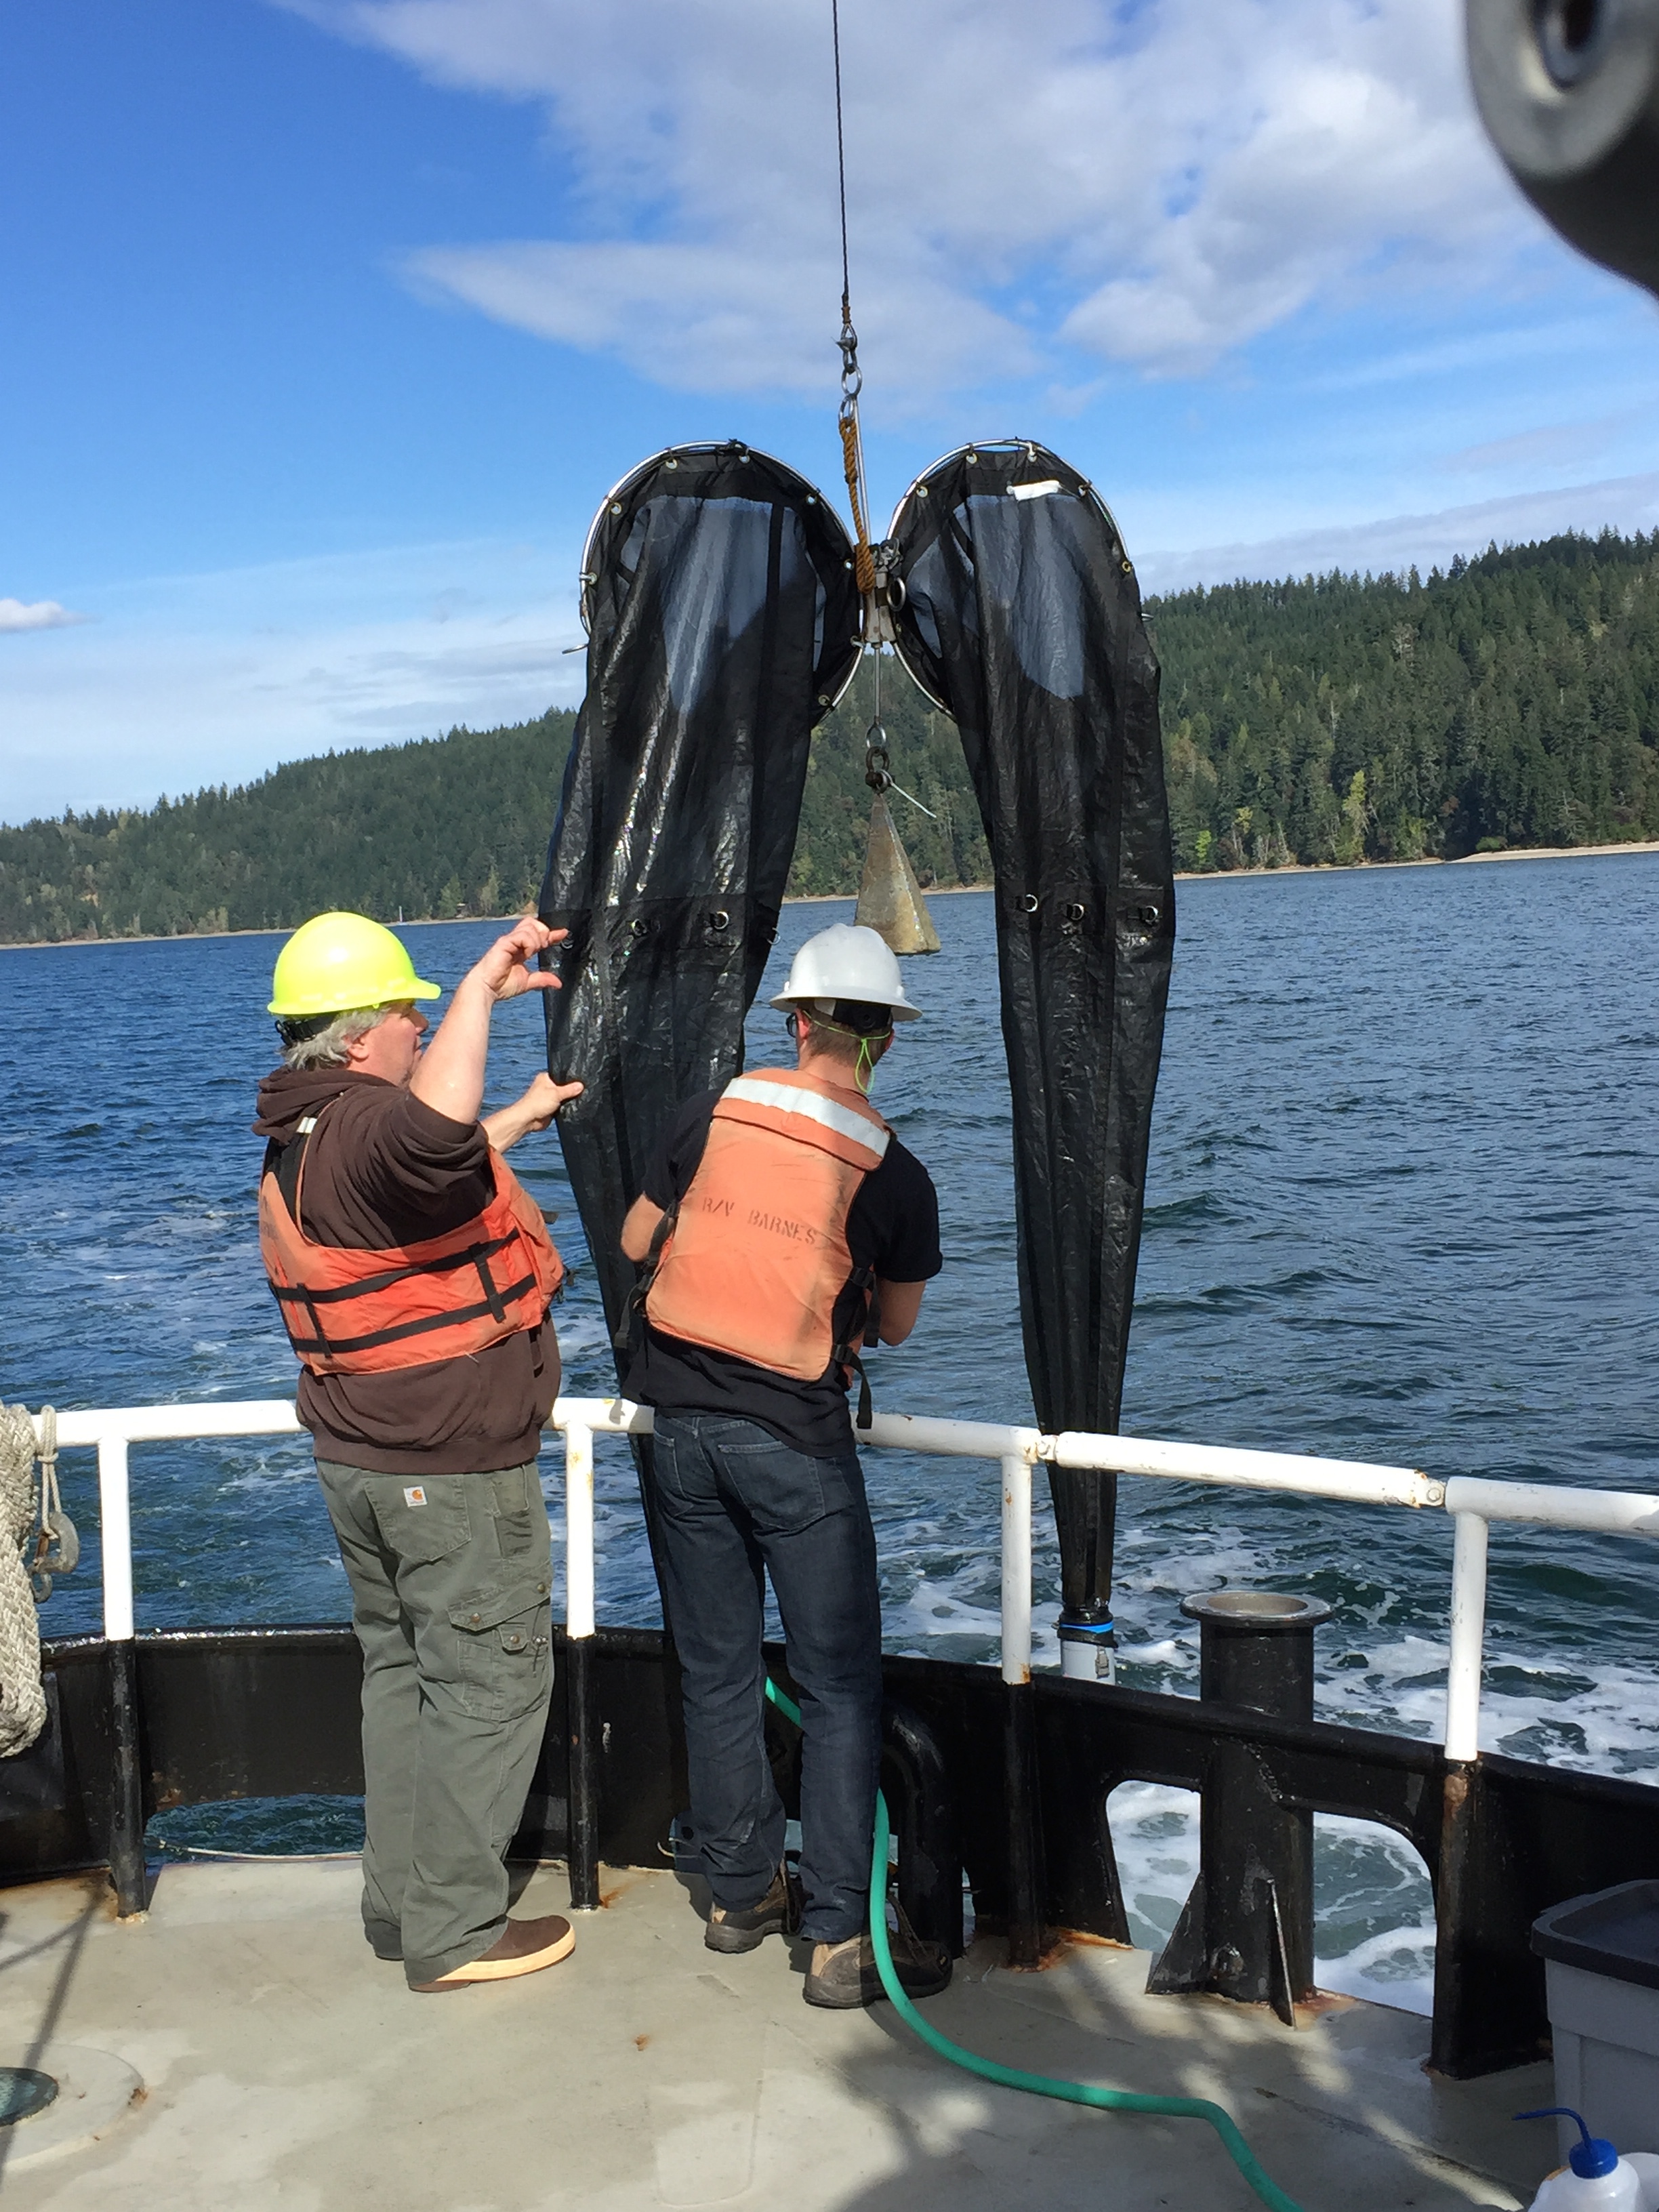
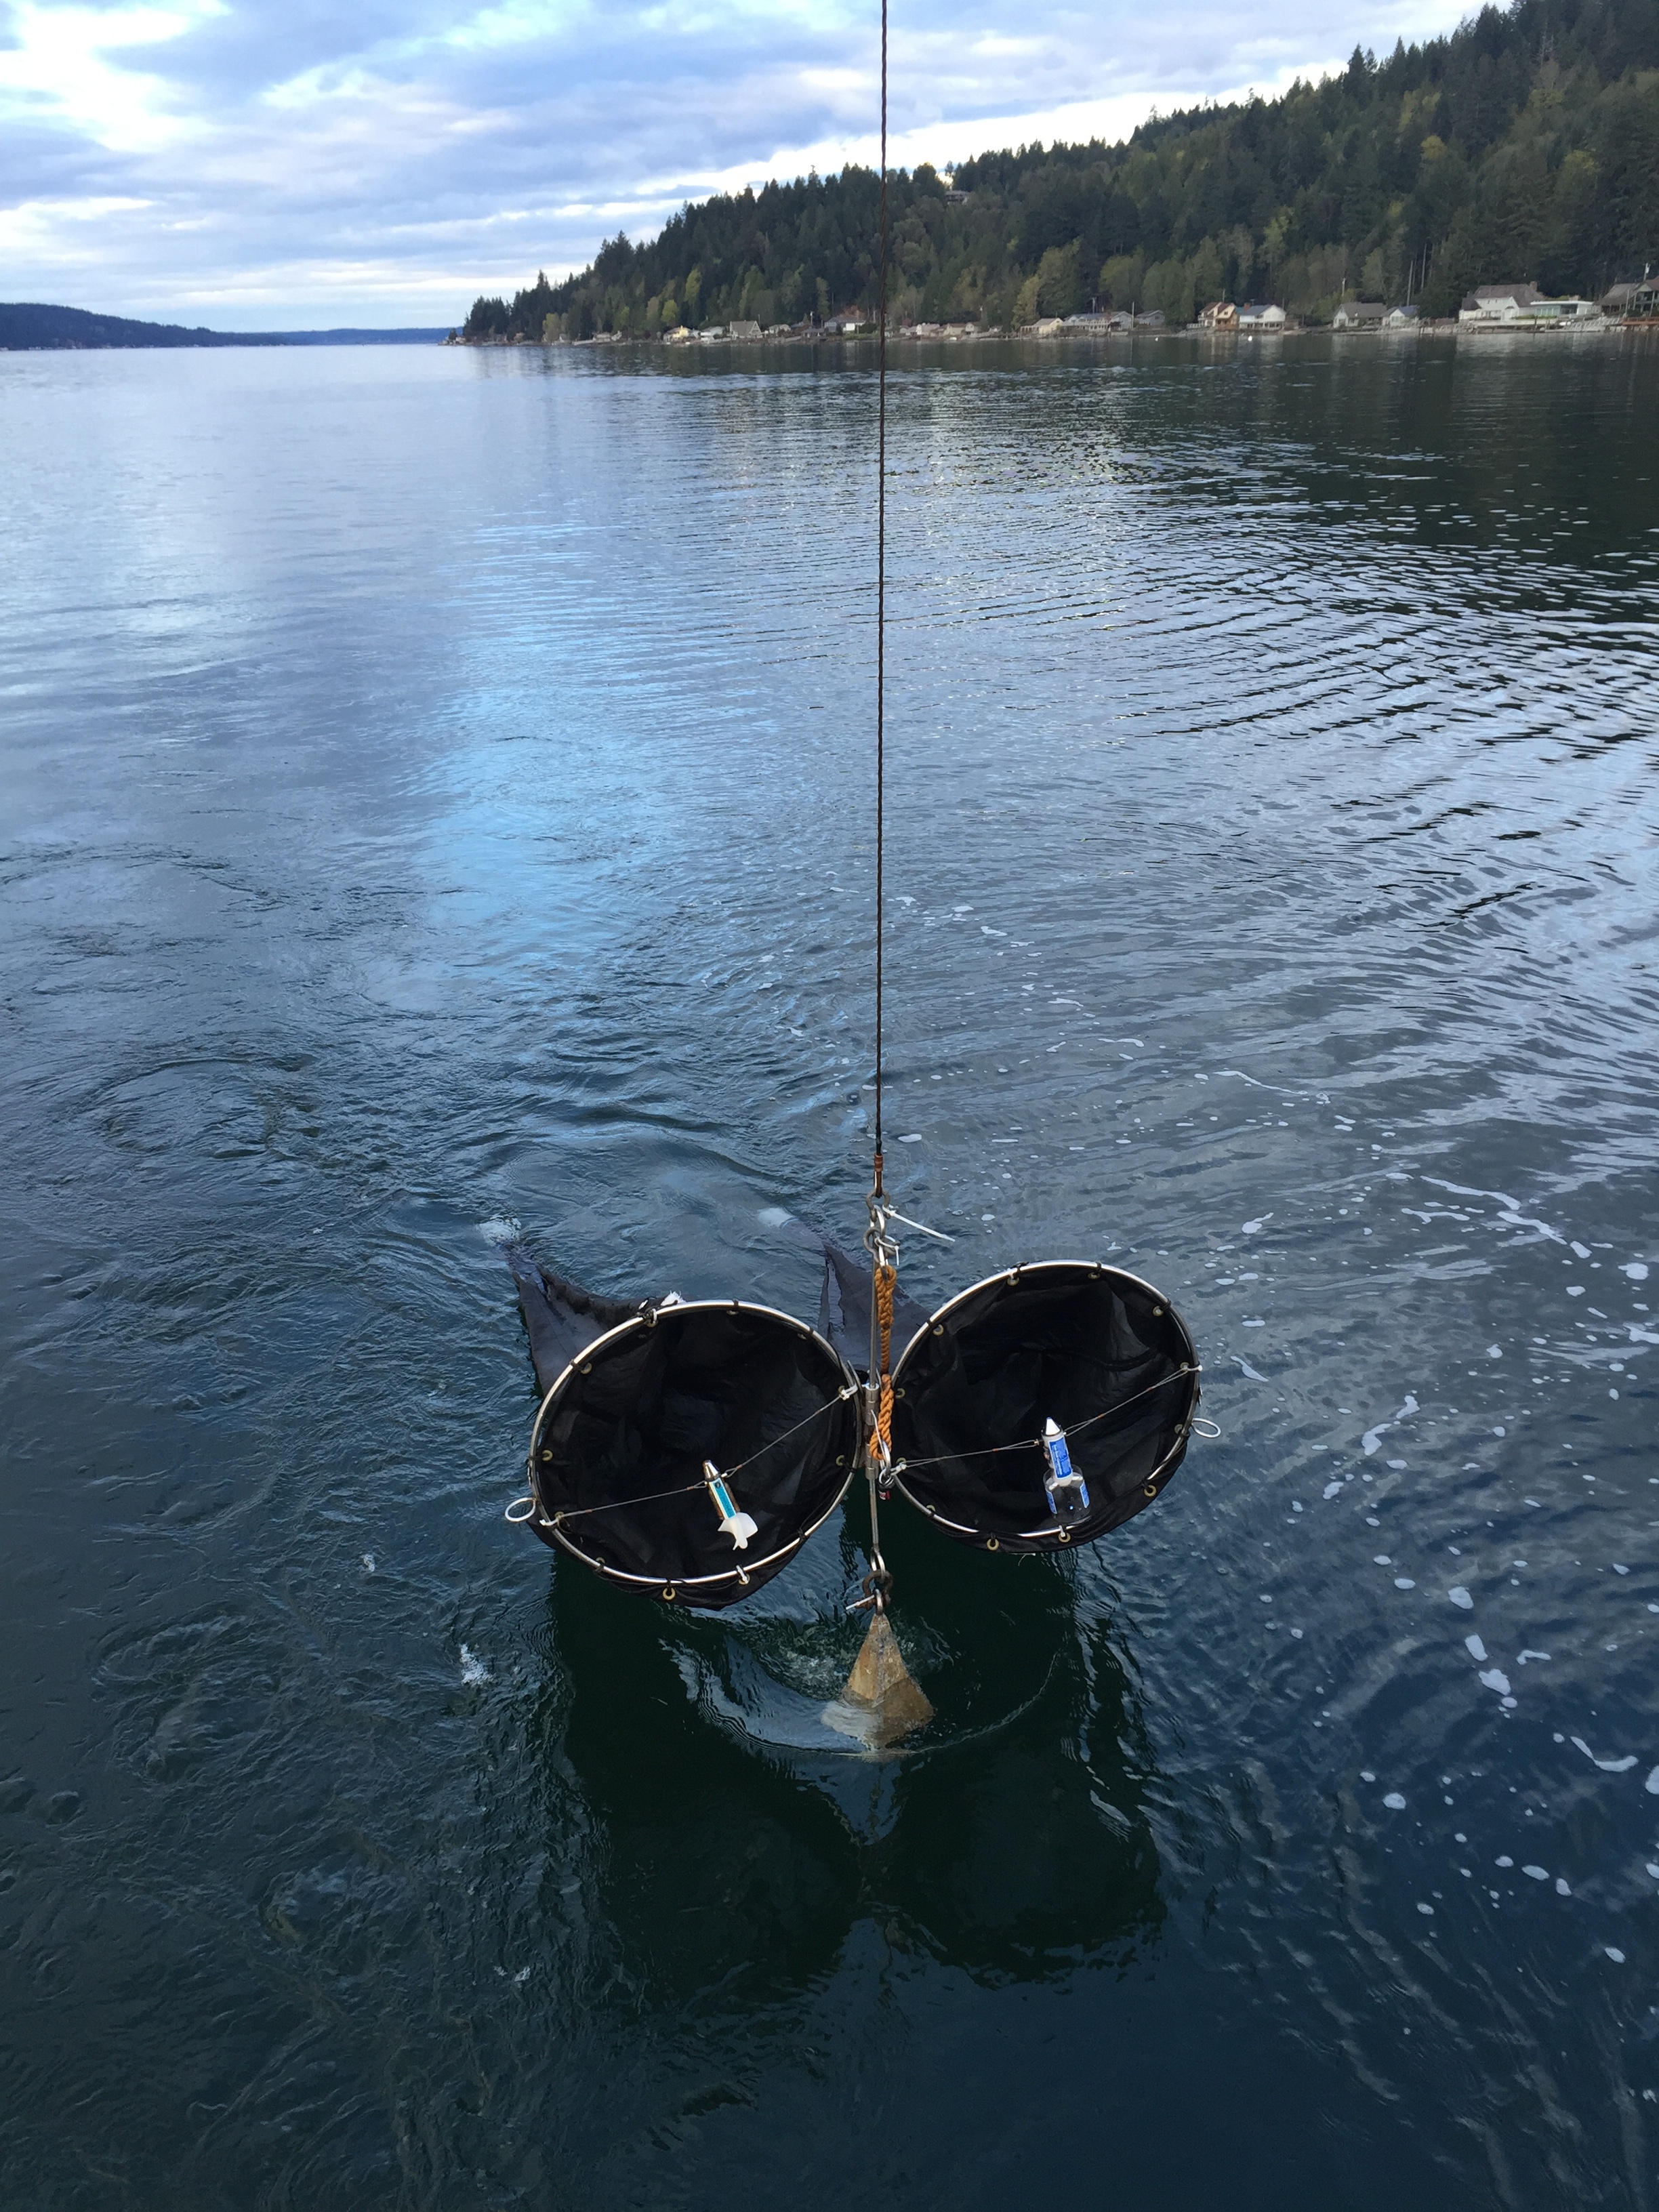
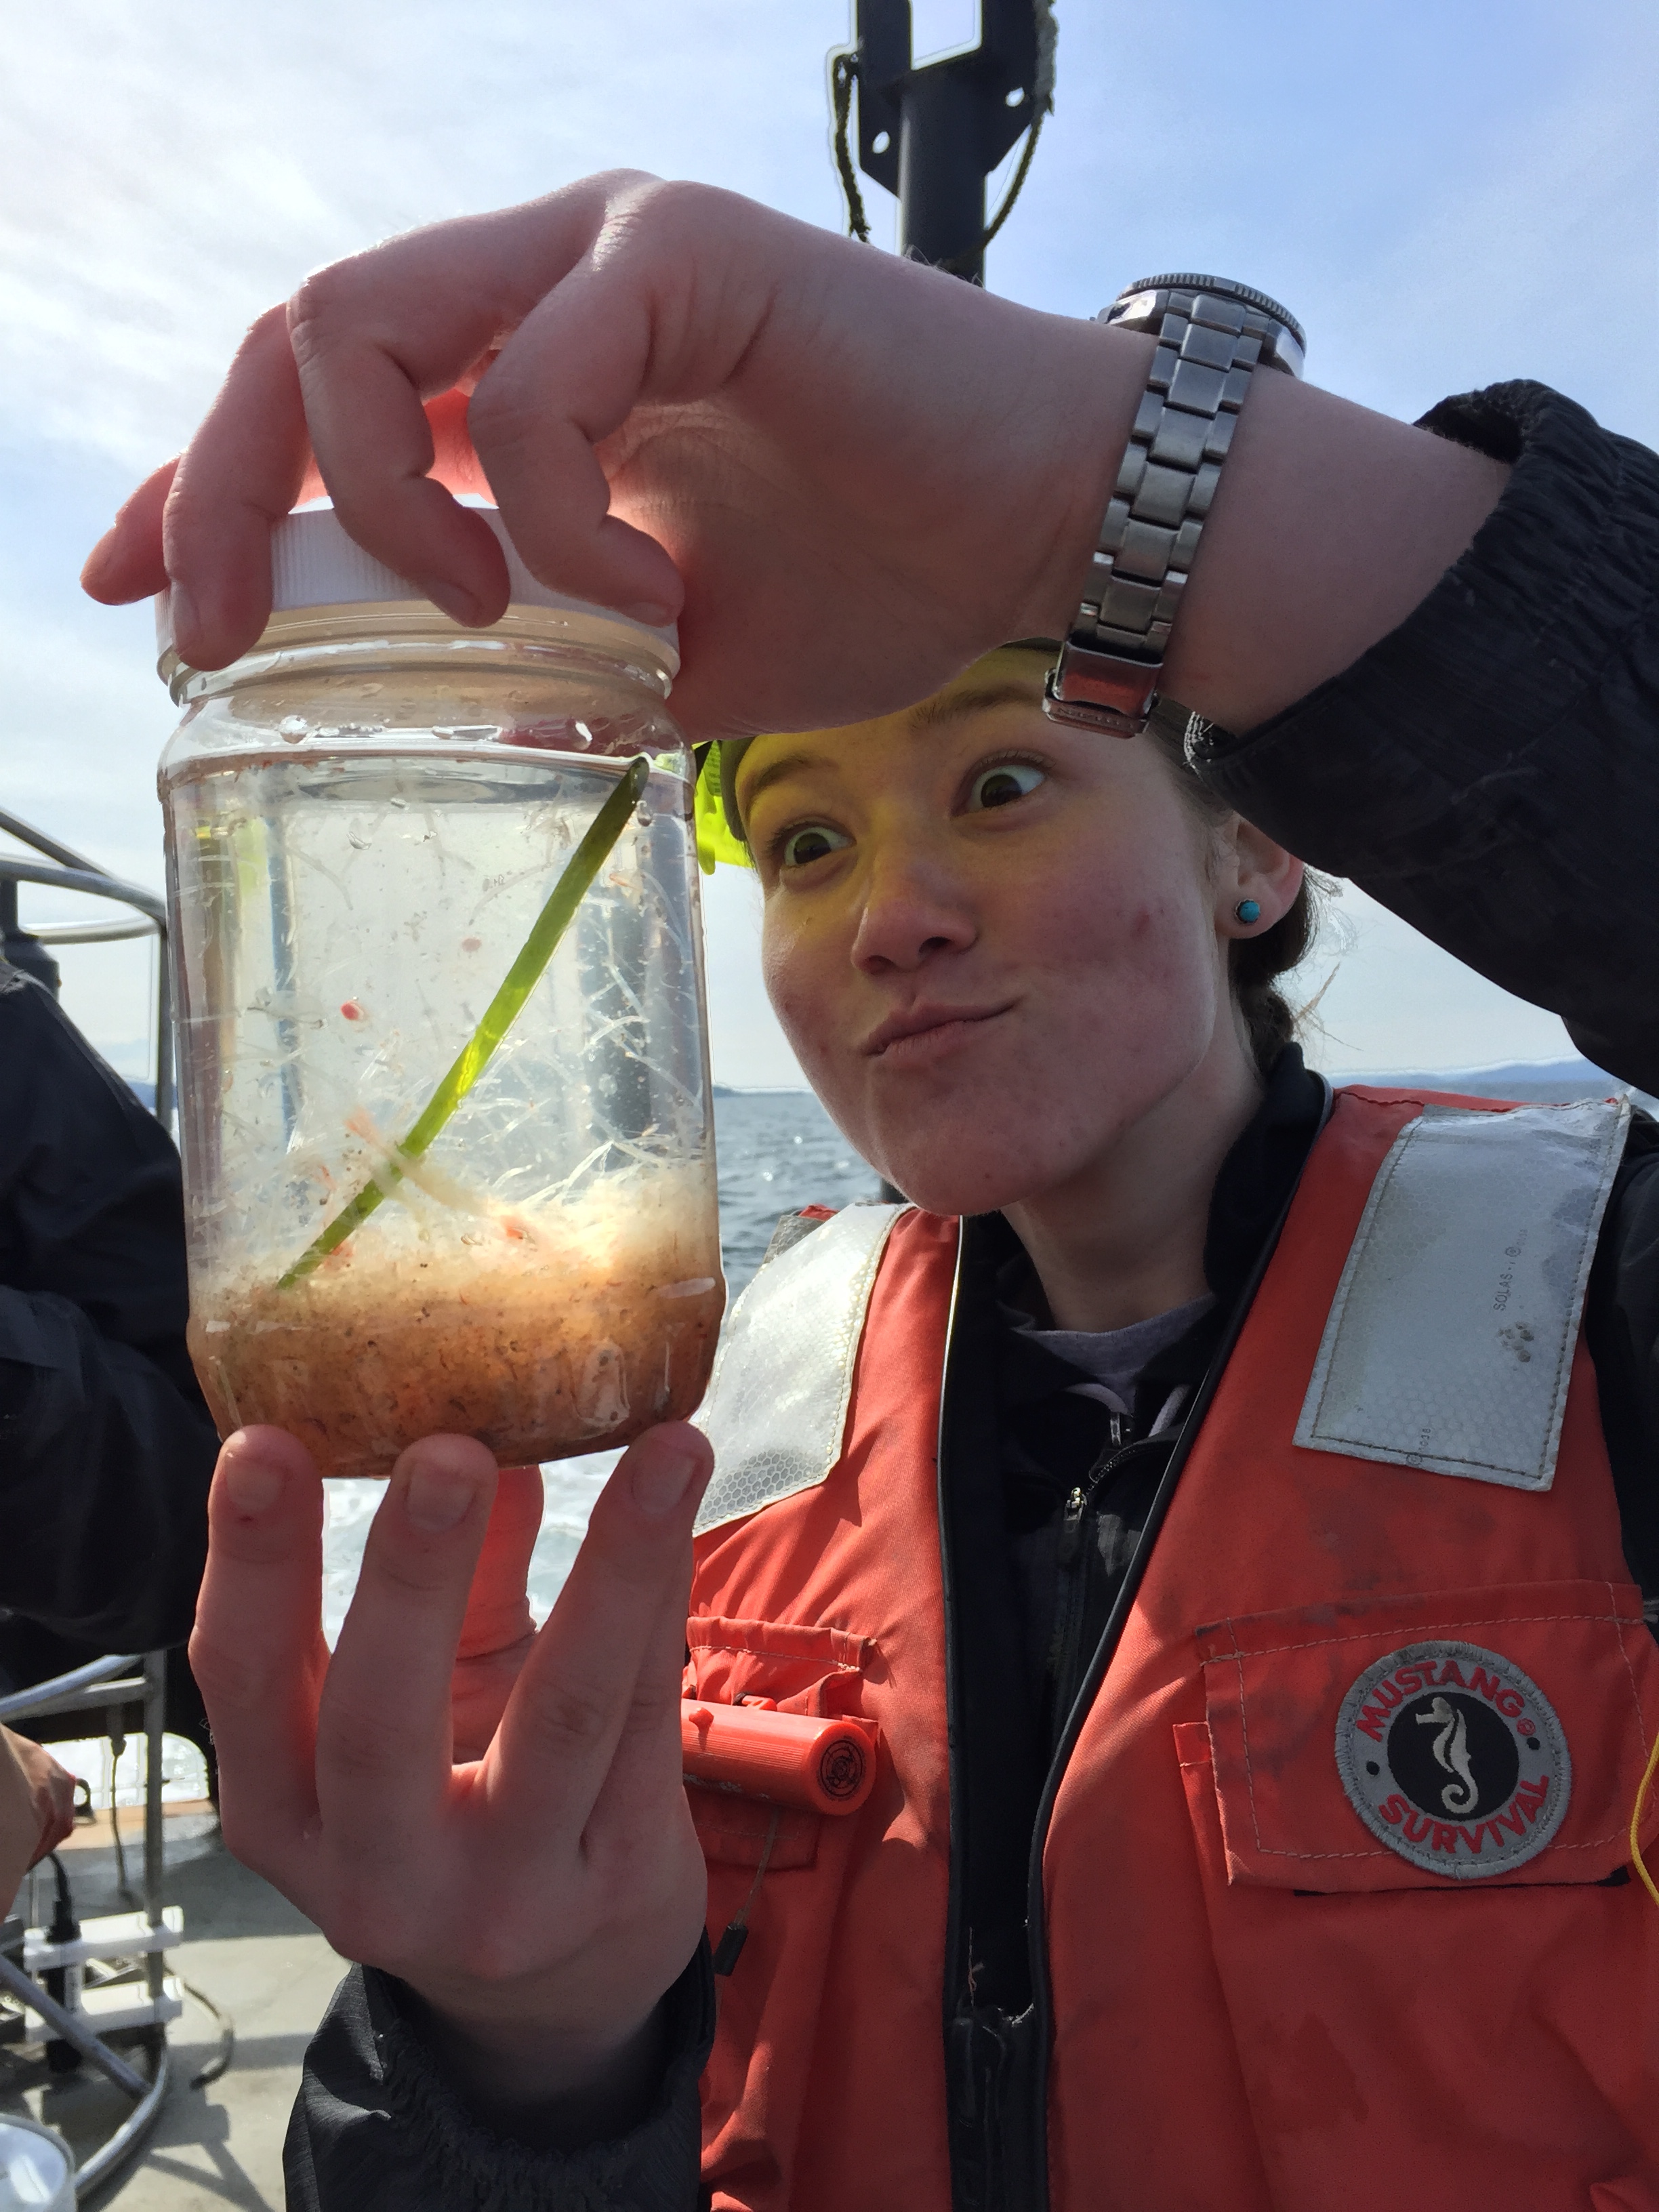
Plankton net tows give back valuable information about the biological community of zooplankton. One species of particular interest are the pteropods, endearingly known as sea butterflies who’s shells are visibly suffering from increasing CO2 conditions:
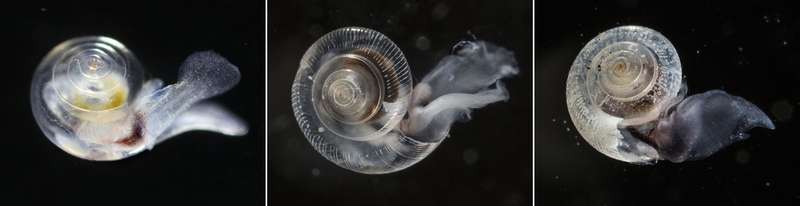
The smooth shell of a healthy pteropod is seen at left. The pteropod in the center was exposed to elevated CO2 conditions in a laboratory, to mimic conditions researchers saw in the wild. And at right, a shell with holes and pits, also produced by laboratory conditions, corresponds to some of the most extreme damage scientists expect to see with elevated CO2. From The Seattle Times SEA CHANGE stories.
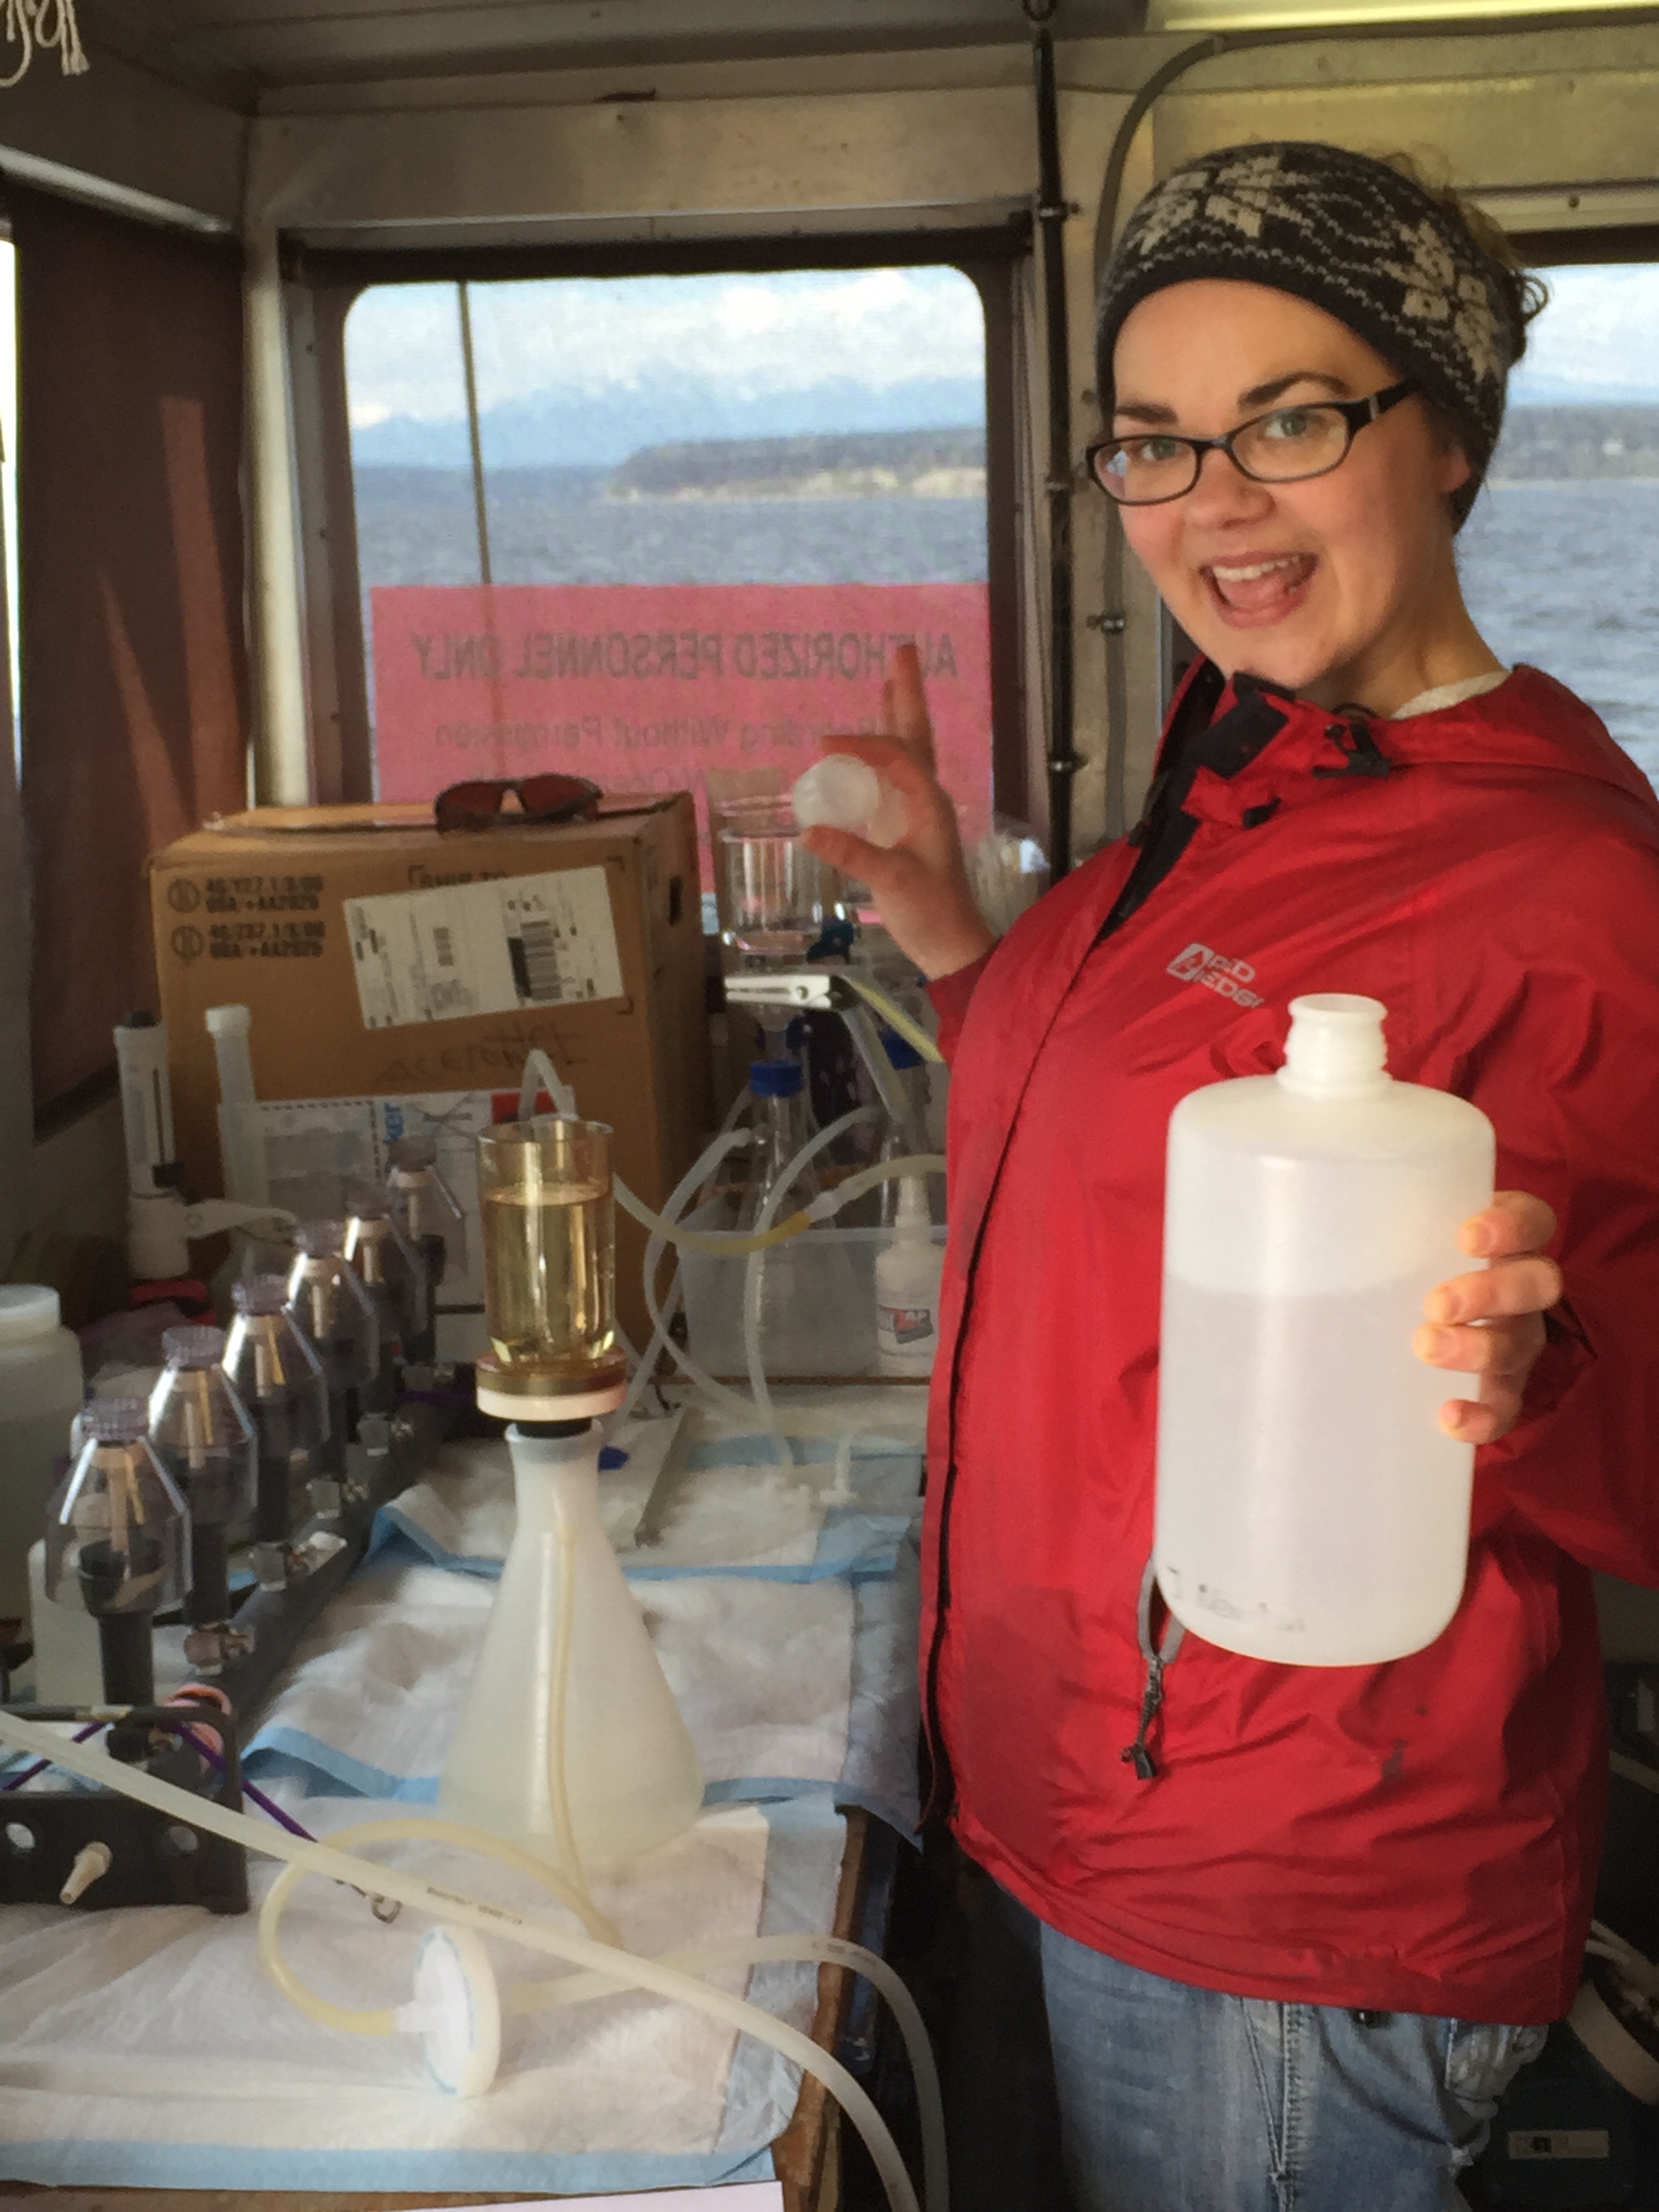
I am a research technician on this ship representing my Principal Investigator, Monica Orellana, with the Institute for Systems Biology. A portion of her research aims to understand ocean acidification effects on the phytoplankton community at a genetic level using next-generation sequencing tools. When I am not collecting my own samples, I help out collecting samples for the head technician, Rachel Vander Giessen.
Feature Woman – Physicist/Oceanographer Rachel Vander Giessen
On this cruise I would like to highlight the lady in charge: Rachel Vander Giessen. She is the technician for the head scientist, Jan Newton, and was on the ship running the science show. She has a bachelor’s degree in physics, spent time on chartered yachts as a naturalist, wanted to become a captain through the Maritime Academy, was a bartender and a barista, and is now a research technician in oceanography. She is the epitome of someone who is highly involved and doing cool shit without having a PhD. You have to read more about her in her interview (link coming soon).
Want more photos of the trip aboard the R/V Clifford A Barnes?
Click here for Spring 2015 and here for Fall 2015.
Want to know even more about Ocean Acidification? Click any of the easy-follow links listed on WOAC’s site:
20 Facts About Ocean Acidification (updated November 2013)
Ocean Acidification in the Pacific Northwest
Ocean Acidification Center Another Example of State Leading the Nation
Blue Ribbon Panel on Ocean Acidification
Share this:


Recent Comments